
1. Moving the Markets
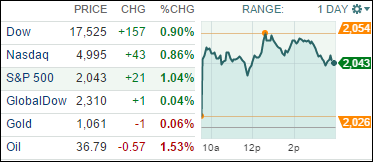
Stocks jumped Tuesday with the Dow gaining 157 points as the price of crude oil rallied for a second day and Wall Street awaits the Federal Reserve’s decision Wednesday on interest rate hikes.
The Federal Reserve kicked off its two-day policy meeting Tuesday, and futures are pricing in a roughly 80% chance the Fed will hike interest rates for the first time since 2006. The general consensus on Wall Street is that Yellen will reassure markets that the pace of increases in 2016 will be very slow and deliberate, a so-called dovish message that would reduce some of the angst and fallout of any rate hike. Depending on the wording, we could see more upside momentum in form of a relief rally.
Apple (AAPL) has been stealing headlines over the past two days, not because of snazzy new products, but rather that the stock has been falling hard. Shares continued to drop today and have disappointed over the last 30 days, rising just 0.2%, which is miniscule compared to other tech stocks that have been rallying. The latest concern to hit Apple shares came Monday after Morgan Stanley cut its outlook for Apple smartphone sales. Morgan Stanley now sees smartphone shipments to fall 6% in the current fiscal year.
All of our 10 ETFs in the Spotlight gained as the rebound from an oversold condition continued for a second day. Leading the pack were the Financials (IYF) with +2.16% while Consumer Discretionaries (XLY) lagged with +0.55%.
2. ETFs in the Spotlight
In case you missed the announcement and description of this section, you can read it here again.
It features 10 broadly diversified ETFs from my HighVolume list as posted every Monday. Furthermore, they are screened for the lowest MaxDD% number meaning they have been showing better resistance to temporary sell offs than all others over the past year.
Here are the 10 candidates:
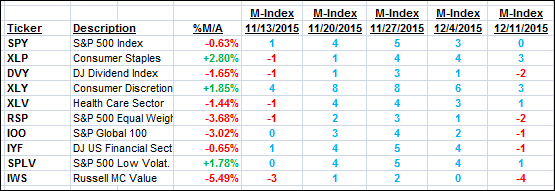
The above table simply demonstrates the magnitude with which some of the ETFs are fluctuating in regards to their positions above or below their respective individual trend lines (%M/A). A break below, represented by a negative number, shows weakness, while a break above, represented by a positive percentage, shows strength.
For hundreds of ETF/Mutual fund choices, be sure to reference Thursday’s StatSheet.
Year to date, here’s how the above candidates have fared so far:
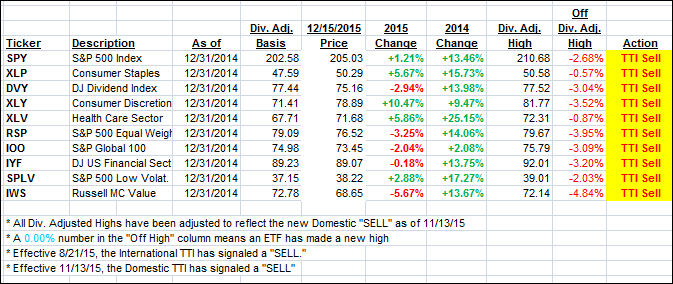
Again, the first table above shows the position of the various ETFs in relation to their respective long term trend lines (%M/A), while the second one tracks their trailing sell stops in the “Off High” column. The “Action” column will signal a “Sell” once the -7.5% point has been taken out in the “Off High” column.
3. Trend Tracking Indexes (TTIs)
Our Domestic Trend Tracking Index (TTI) improved again but still remains stuck on the bearish side of the trend line, as you can see:
Domestic TTI: -0.72% (last close -1.16%)—Sell signal effective 11/13/2015
International TTI: -5.47% (last close -6.23%)—Sell signal effective 8/21/2015
Disclosure: I am obliged to inform you that I, as well as advisory clients of mine, own some of these listed ETFs. Furthermore, they do not represent a specific investment recommendation for you, they merely show which ETFs from the universe I track are falling within the guidelines specified.
Contact Ulli