
1. Moving the Markets
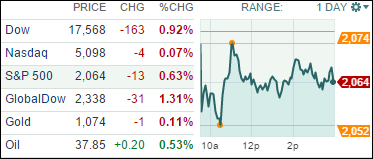
Stocks ended down Tuesday but cut early sharp losses as financial markets came under pressure for a second straight day from volatile oil prices.
Oil prices fell 6% Monday and dropped as much as 2.7% to $36.64 a barrel in early trading today before reversing course and closing at $37.60 a barrel. The recent rout in oil prices was spurred by the decision by OPECers to leave production levels unchanged as oil stockpiles continue to rise, driving prices lower.
You may remember the big beer merger of late between Busch and Miller. Today, the CEO (Carlos Brito) of Anheuser-Busch InBev, told Senate lawmakers the proposed transaction between his firm and SABMiller, the world’s two largest brewing giants, wouldn’t stifle competition in the U.S. beer market. However, the planned $107 billion merger between the owners of got its first public scrutiny today with debate over whether the deal would freeze out local U.S. brands like Dogfish Head, Castle Danger and Rogue. Seeking to dismiss fears of unfair competition, Brito said regional craft beers accounted for less than 4% of the U.S. market in 1997, and have an 11% share now.
And in Mexican fast food news, it wasn’t a great day for Chipotle (CMG). Shares of the burrito chain, which had been one of the hottest stocks going since late 2012, has apparently turned into an investment hazard. They dropped 2.3% to $539.13, which places them at 29% lower from their high point over the past year.
Again, 9 of our 10 ETFs in the Spotlight headed south while one bucked the trend and closed up. Today, it was Healthcare (XLV), which managed to eke out a gain of +0.22%. Leading to the downside were the financials (IYF) with a loss of -1.12%.
2. ETFs in the Spotlight
In case you missed the announcement and description of this section, you can read it here again.
It features 10 broadly diversified ETFs from my HighVolume list as posted every Monday. Furthermore, they are screened for the lowest MaxDD% number meaning they have been showing better resistance to temporary sell offs than all others over the past year.
Here are the 10 candidates:
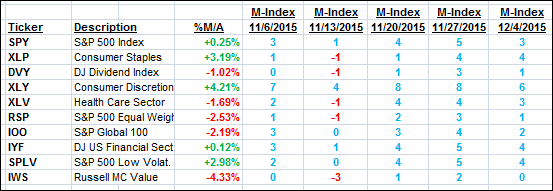
The above table simply demonstrates the magnitude with which some of the ETFs are fluctuating in regards to their positions above or below their respective individual trend lines (%M/A). A break below, represented by a negative number, shows weakness, while a break above, represented by a positive percentage, shows strength.
For hundreds of ETF/Mutual fund choices, be sure to reference Thursday’s StatSheet.
Year to date, here’s how the above candidates have fared so far:
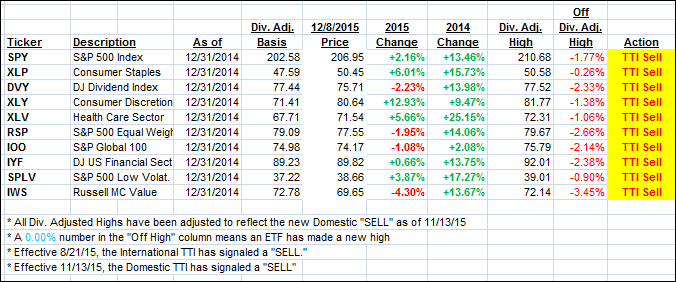
Again, the first table above shows the position of the various ETFs in relation to their respective long term trend lines (%M/A), while the second one tracks their trailing sell stops in the “Off High” column. The “Action” column will signal a “Sell” once the -7.5% point has been taken out in the “Off High” column.
3. Trend Tracking Indexes (TTIs)
Our Domestic Trend Tracking Index (TTI) slipped again is now at the threshold of moving below its long-term trend line again. The major trend direction is still uncertain, and I don’t expect it to change until the Fed makes his interest rate announcement next week.
Here’s how we ended the day:
Domestic TTI: +0.02% (last close +0.27%)—Sell signal effective 11/13/2015
International TTI: -4.37% (last close -3.65%)—Sell signal effective 8/21/2015
Disclosure: I am obliged to inform you that I, as well as advisory clients of mine, own some of these listed ETFs. Furthermore, they do not represent a specific investment recommendation for you, they merely show which ETFs from the universe I track are falling within the guidelines specified.
Contact Ulli