
1. Moving the Markets
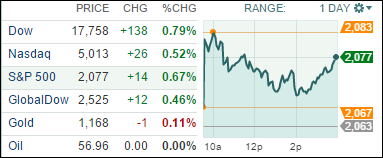
To heck with Greece is what Wall Street muttered today and returned the focus back on domestic economic data. The major indexes managed to build on yesterday’s rebound and closed up higher despite a mid-day pullback.
The Greek saga continues to play in the background with its upcoming referendum on Sunday to let the people decide on the austerity demands of the creditors. New bailout deals are hitting the news wires every so often but are usually denied within a short time frame. I think next week will bring some clarity as to the future of Greece’s alliances.
This morning’s ADP payroll report was better than expected, which bodes well for tomorrow’s payroll numbers. That provided some of the firepower supporting today’s move higher.
All of our 10 ETFs in the Spotlight joined the rebound and closed up. Leading the charge was the Low Volatility S&P (SPLV) with a gain of 1.46%. The laggard was the MC Value (IWS), which added 0.49%.
2. ETFs in the Spotlight
In case you missed the announcement and description of this section, you can read it here again.
It features 10 broadly diversified ETFs from my HighVolume list as posted every Monday. Furthermore, they are screened for the lowest MaxDD% number meaning they have been showing better resistance to temporary sell offs than all others over the past year.
Here are the 10 candidates:
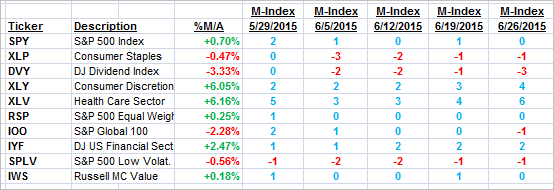
The above table simply demonstrates the magnitude with which some of the ETFs are fluctuating in regards to their positions above or below their respective individual trend lines (%M/A). A break below, represented by a negative number, shows weakness, while a break above, represented by a positive percentage, shows strength.
For hundreds of ETF/Mutual fund choices, be sure to reference Thursday’s StatSheet.
Year to date, here’s how the above candidates have fared so far:
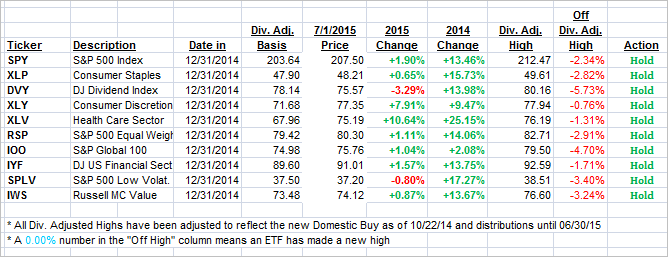
Again, the first table above shows the position of the various ETFs in relation to their respective long term trend lines (%M/A), while the second one tracks their trailing sell stops in the “Off High” column. The “Action” column will signal a “Sell” once the -7.5% point has been taken out in the “Off High” column.
3. Trend Tracking Indexes (TTIs)
Our Trend Tracking Indexes (TTIs) managed to eke out some gains and closed as follows:
Domestic TTI: +1.00% (last close +0.80%)—Buy signal effective 10/22/2014
International TTI: +1.78% (last close +1.26%)—Buy signal effective 2/13/2015
Disclosure: I am obliged to inform you that I, as well as advisory clients of mine, own some of these listed ETFs. Furthermore, they do not represent a specific investment recommendation for you, they merely show which ETFs from the universe I track are falling within the guidelines specified.
Contact Ulli