
1. Moving the Markets
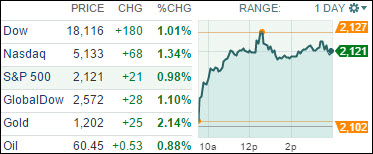
Domestic stocks shifted into overdrive today rallying sharply and sending the Nasdaq and Russell 2000 to record highs, while all other major indexes scored nicely.
Supporting today’s euphoria was the fact that the Fed did not only not produce any earthshaking news yesterday but also set a dovish tone in its announcement of a slower pace in regards to potential rate hikes. That’s all the bulls needed to digest, after a good night’s sleep, and we were able to add to yesterday’s meager advance.
Despite the global background not being very favorable towards growth and equities, there was no bearish news, so the indexes took the path of least resistance, which was up. Whether this rip-roaring day turns into a blow-off topping formation remains to be seen; for right now, Wall Street was all smiles.
With the indexes racing full steam ahead, it’s no surprise that all of our 10 ETFs in the Spotlight joined the rally and closed sharply higher. The leader today was Healthcare (XLV), which added 1.41%, while the laggard was the Russell MC Value (IWS) with “only” a 0.81% gain.
2. ETFs in the Spotlight
In case you missed the announcement and description of this section, you can read it here again.
It features 10 broadly diversified ETFs from my HighVolume list as posted every Monday. Furthermore, they are screened for the lowest MaxDD% number meaning they have been showing better resistance to temporary sell offs than all others over the past year.
Here are the 10 candidates:
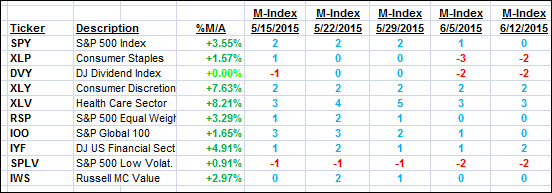
The above table simply demonstrates the magnitude with which some of the ETFs are fluctuating in regards to their positions above or below their respective individual trend lines (%M/A). A break below, represented by a negative number, shows weakness, while a break above, represented by a positive percentage, shows strength.
For hundreds of ETF/Mutual fund choices, be sure to reference Thursday’s StatSheet.
Year to date, here’s how the above candidates have fared so far:
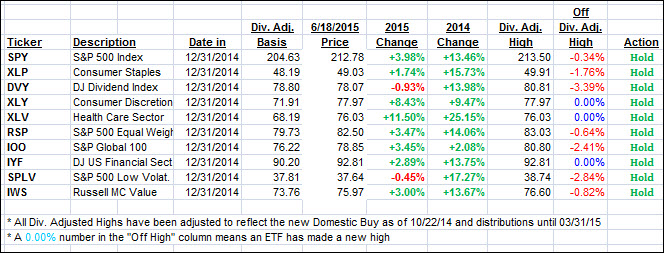
Again, the first table above shows the position of the various ETFs in relation to their respective long term trend lines (%M/A), while the second one tracks their trailing sell stops in the “Off High” column. The “Action” column will signal a “Sell” once the -7.5% point has been taken out in the “Off High” column.
3. Trend Tracking Indexes (TTIs)
Our Trend Tracking Indexes (TTIs) joined the party and stepped deeper into bullish territory by closing the day as follows:
Domestic TTI: +2.24% (last close +1.87%)—Buy signal effective 10/22/2014
International TTI: +2.95% (last close +2.85%)—Buy signal effective 2/13/2015
Disclosure: I am obliged to inform you that I, as well as advisory clients of mine, own some of these listed ETFs. Furthermore, they do not represent a specific investment recommendation for you, they merely show which ETFs from the universe I track are falling within the guidelines specified.
Contact Ulli