
1. Moving the Markets
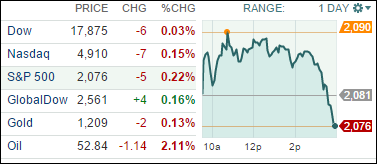
Stocks withered early gains and fell sharply in the last hour of trading, as the major indexes closed lower, breaking a two-day bunny hop winning streak. April has always been a volatile month, as investors are typically on edge in advance of Q1 earnings season. First-quarter earnings season kicks off Wednesday as Alcoa (AA) will be the first to report.
Speaking of the earnings calendar, here’s a quick snapshot of 5 of the Top 10 largest companies earnings release dates. April 14 – Google (GOOG), Wells Fargo &Co (WFC) and Johnson & Johnson (JNJ); April 17 – General Electric (GE); April 22 – Facebook (FB).
Which sectors actually performed today? Health care and energy were the only sectors of the 10 S&P 500 sectors to hold onto gains, while utilities led the market lower as the sector dropped more than 1%.
In M&A news, shares of FedEx (FDX) rose 2.7% after announcing it was expanding into Europe in a $4.8 billion deal to buy Dutch rival TNT Express. The all-cash deal will allow the package delivery company to better compete overseas with United Parcel Service.
9 of our 10 ETFs in the Spotlight slipped and headed south with only healthcare (XLV) bucking the trend by closing up +0.24%.
2. ETFs in the Spotlight
In case you missed the announcement and description of this section, you can read it here again.
It features 10 broadly diversified ETFs from my HighVolume list as posted every Monday. Furthermore, they are screened for the lowest MaxDD% number meaning they have been showing better resistance to temporary sell offs than all others over the past year.
Here are the 10 candidates:
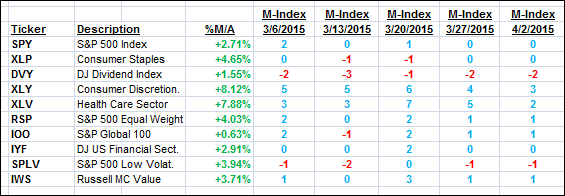
The above table simply demonstrates the magnitude with which some of the ETFs are fluctuating in regards to their positions above or below their respective individual trend lines (%M/A). A break below, represented by a negative number, shows weakness, while a break above, represented by a positive percentage, shows strength.
For hundreds of ETF/Mutual fund choices, be sure to reference Thursday’s StatSheet.
Year to date, here’s how the above candidates have fared so far:
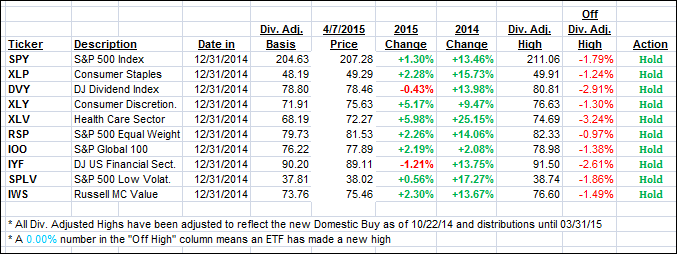
Again, the first table above shows the position of the various ETFs in relation to their respective long term trend lines (%M/A), while the second one tracks their trailing sell stops in the “Off High” column. The “Action” column will signal a “Sell” once the -7.5% point has been taken out in the “Off High” column.
3. Trend Tracking Indexes (TTIs)
Our Trend Tracking Indexes (TTIs) were mixed again with the Domestic one moving lower while the International one edged up a tad.
Here’s how we ended up:
Domestic TTI: +2.99% (last close +3.12%)—Buy signal effective 10/22/2014
International TTI: +4.39% (last Friday +4.37%)—Buy signal effective 2/13/2015
Disclosure: I am obliged to inform you that I, as well as advisory clients of mine, own some of these listed ETFs. Furthermore, they do not represent a specific investment recommendation for you, they merely show which ETFs from the universe I track are falling within the guidelines specified.
Contact Ulli