
1. Moving the Markets
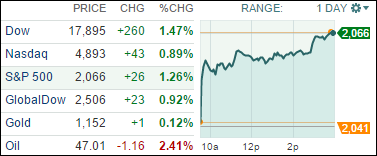
Gains today put both the S&P 500 and Dow back into positive territory for the year. Eyes were focused on tentative announcements from the Fed regarding their stress testing on top U.S. lenders, which exceeded expectations. The conclusions were that 29 of the 31 top banks all passed with flying colors. Investors jumped back on those stocks accordingly. The largest gainers were Morgan Stanley (MS) and Citigroup (C).
Some economic news of note that came in today was that retail sales took a shard downturn of 0.6% in February. Also, weekly jobless claims fell last week to 289,000, however, this was predicted.
Moving on to oil, The U.S. benchmark (WTI) settled at $57.08 a barrel today, which was down slightly from yesterday. As you may know, oil price fluctuations have been under much speculation considering the continued rise in the USD. Typically, a weaker dollar makes dollar-priced crude cheaper for buyers using stronger currencies, tending to support demand and, in turn, prices.
All of our 10 ETFs in the Spotlight joined the rebound rally and closed higher. Taking the lead were the financials (IYF) adding +2.12% while the Global 100 (IOO) was in last place with +0.98%. Recently lagging was SPLV, but it sported a nice comeback with +1.73%.
2. ETFs in the Spotlight
In case you missed the announcement and description of this section, you can read it here again.
It features 10 broadly diversified ETFs from my HighVolume list as posted every Monday. Furthermore, they are screened for the lowest MaxDD% number meaning they have been showing better resistance to temporary sell offs than all others over the past year.
Here are the 10 candidates:
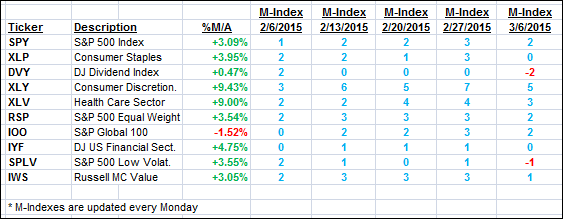
The above table simply demonstrates the magnitude with which some of the ETFs are fluctuating in regards to their positions above or below their respective individual trend lines (%M/A). A break below, represented by a negative number, shows weakness, while a break above, represented by a positive percentage, shows strength.
For hundreds of ETF/Mutual fund choices, be sure to reference Thursday’s StatSheet.
Year to date, here’s how the above candidates have fared so far:
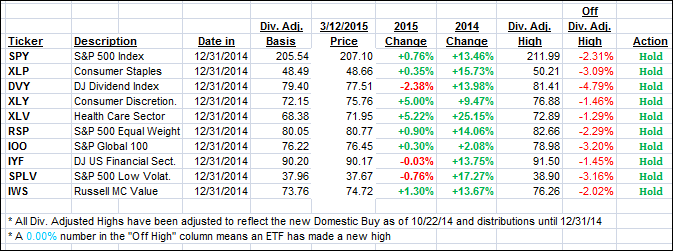
Again, the first table above shows the position of the various ETFs in relation to their respective long term trend lines (%M/A), while the second one tracks their trailing sell stops in the “Off High” column. The “Action” column will signal a “Sell” once the -7.5% point has been taken out in the “Off High” column.
3. Trend Tracking Indexes (TTIs)
Our Trend Tracking Indexes (TTIs) wiped out their recent losses and recovered nicely.
Here’s how we ended up:
Domestic TTI: +2.96% (last close +2.24%)—Buy signal effective 10/22/2014
International TTI: +2.52% (last close +1.60%)—Buy signal effective 2/13/2015
Disclosure: I am obliged to inform you that I, as well as advisory clients of mine, own some of these listed ETFs. Furthermore, they do not represent a specific investment recommendation for you, they merely show which ETFs from the universe I track are falling within the guidelines specified.
Contact Ulli