
1. Moving the Markets
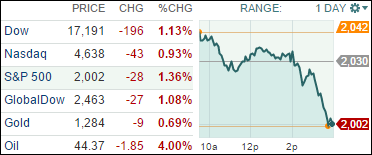
Stocks took a dive today, ending another wild ride with a plunge deeper into the red after the Federal Reserve’s latest policy statement.
The Federal Reserve gave no indication today that it would stand down from plans to raise interest rates this year, noting that it expects unusually low inflation to gradually pick up as the “transitory effects” of tumbling oil prices fade.
Speaking of the slick commodity, oil prices slid again today. U.S. crude oil fell 4%, volatile as it has been and plunged deeper into the red after the Federal Reserve’s latest policy statement. The Fed used more positive language to describe the outlook for the economy and the job market here at home; however, it seemed that Wall Street wasn’t buying into it.
In tech, Facebook (FB) topped earnings estimates for the seventh straight quarter. Facebook reported fourth-quarter revenue of $3.85 billion, an increase of 49% from $2.59 billion in the fourth quarter of 2013. Analysts had expected revenue of $3.77 billion. So, there is much to tip your hat to if you are looking at Facebook’s numbers to kick off the year.
Slipping and sliding, all of our 10 ETFs in the Spotlight headed south with the financials (IYF) leading the way by surrendering -1.82%; YTD, however, 4 of them still remain on the plus side as you can see in section 2.
2. ETFs in the Spotlight
In case you missed the announcement and description of this section, you can read it here again.
It features 10 broadly diversified ETFs from my HighVolume list as posted every Monday. Furthermore, they are screened for the lowest MaxDD% number meaning they have been showing better resistance to temporary sell offs than all others over the past year.
Here are the 10 candidates:
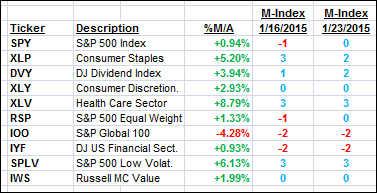
The above table simply demonstrates the magnitude with which some of the ETFs are fluctuating in regards to their positions above or below their respective individual trend lines (%M/A). A break below, represented by a negative number, shows weakness, while a break above, represented by a positive percentage, shows strength.
For hundreds more ETF/Mutual fund choices, be sure to reference Thursday’s StatSheet.
Year to date, here’s how the above candidates have fared so far:
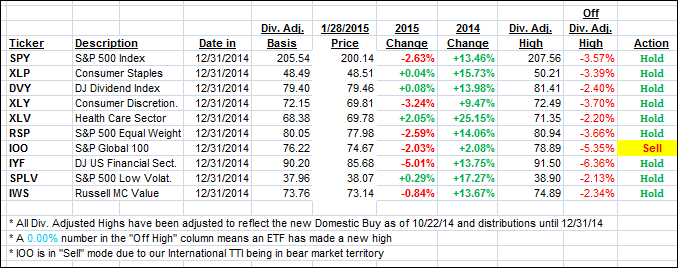
Again, the first table above shows the position of the various ETFs in relation to their respective long term trend lines (%M/A), while the second one tracks their trailing sell stops in the “Off High” column. The “Action” column will signal a “Sell” once the -7.5% point has been taken out in the “Off High” column.
3. Trend Tracking Indexes (TTIs)
Our Trend Tracking Indexes (TTIs) slipped and ended the day as follows:
Domestic TTI: +2.17% (last close +2.53%)—Buy signal since 10/22/2014
International TTI: -0.72% (last close -0.03%)—Sell signal effective 12/15/14
Disclosure: I am obliged to inform you that I, as well as advisory clients of mine, own some of these listed ETFs. Furthermore, they do not represent a specific investment recommendation for you, they merely show which ETFs from the universe I track are falling within the guidelines specified.
Contact Ulli