
1. Moving the Markets
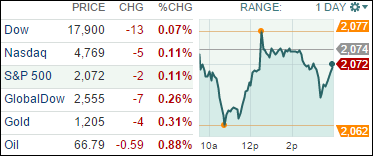
If you read the article yesterday, then you may remember me mentioning that investors would be paying close attention to the ECB’s move on buying bonds to stimulate the Eurozone. Well, today we heard that the European Central Bank decided not to implement a U.S. style stimulus and markets took a small hit accordingly.
ECB head Mario Draghi said the bank has “stepped up” preparations for launching new stimulus measures for the economy, but would not make any decision on further steps early next year. Also, the bank’s benchmark interest rate was left unchanged at 0.05%.
Great news for Starbucks (SBUX) lovers. The stock flirted with an all-time high today after the company unveiled an ambitious growth plan to add stores, new menu offerings and alcoholic beverages. The growth strategy is aimed at doubling annual revenue by the year 2019.
And in the auto world, you may have seen recent headlines that November was a huge month for auto sales. Several automakers, including Subaru and Audi, were powered by November results to all-time annual U.S. sales records. With the economy allegedly picking up and credit still readily available and cheap, things are looking good for December.
1 of our 10 ETFs in the Spotlight closed up and made a new high in the process. See the YTD table for details.
2. ETFs in the Spotlight
In case you missed the announcement and description of this section, you can read it here again.
It features 10 broadly diversified ETFs from my HighVolume list as posted every Monday. Furthermore, they are screened for the lowest MaxDD% number meaning they have been showing better resistance to temporary sell offs than all others over the past year.
Here are the 10 candidates:
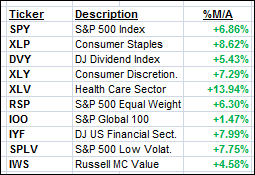
The above table simply demonstrates the magnitude with which some of the ETFs are fluctuating in regards to their positions above or below their respective individual trend lines (%M/A). A break below, represented by a negative number, shows weakness, while a break above, represented by a positive percentage, shows strength.
Year to date, here’s how the above candidates have fared so far:
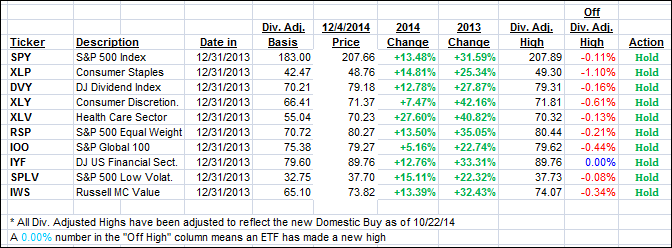
Again, the first table above shows the position of the various ETFs in relation to their respective long term trend lines (%M/A), while the second one tracks their trailing sell stops in the “Off High” column. The “Action” column will signal a “Sell” once the -7.5% point has been taken out in the “Off High” column.
3. Trend Tracking Indexes (TTIs)
Our Trend Tracking Indexes (TTIs) pulled back slightly with the major indexes.
Here’s how we ended up:
Domestic TTI: +3.62% (last close +3.69%)—Buy signal since 10/22/2014
International TTI: +1.36% (last close +1.48%)—New Buy signal effective 11/24/14
Disclosure: I am obliged to inform you that I, as well as advisory clients of mine, own some of these listed ETFs. Furthermore, they do not represent a specific investment recommendation for you, they merely show which ETFs from the universe I track are falling within the guidelines specified.
Contact Ulli