
1. Moving the Markets
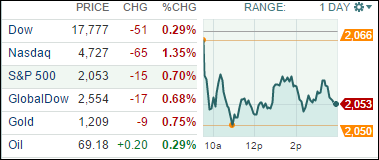
Finally, the relentless upward march into record territory came to an end, at least for the time being, as equities headed south with the S&P 500 giving back a modest 0.7%, which was its largest one-day loss in more than a month.
Contributing to the sour sentiment was not only Apple’s mini flash-crash but also slowing US manufacturing growth, which continued its downward path for the third straight month. Joining the party were the Eurozone and Asia, where growth eased as well despite heavy price cuts to stimulate demand.
Not helping matters were preliminary Holiday shopping reports indicating that in-store sales were some 6.4% less than last year due to increased online shopping activity.
All of our 10 ETFs in the Spotlight closed lower today as the indexes see-sawed and rebound attempts failed to break out above the unchanged line.
2. ETFs in the Spotlight
In case you missed the announcement and description of this section, you can read it here again.
It features 10 broadly diversified ETFs from my HighVolume list as posted every Monday. Furthermore, they are screened for the lowest MaxDD% number meaning they have been showing better resistance to temporary sell offs than all others over the past year.
Here are the 10 candidates:
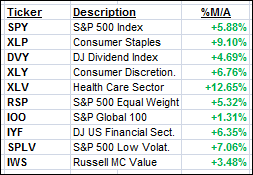
The above table simply demonstrates the magnitude with which some of the ETFs are fluctuating in regards to their positions above or below their respective individual trend lines (%M/A). A break below, represented by a negative number, shows weakness, while a break above, represented by a positive percentage, shows strength.
Year to date, here’s how the above candidates have fared so far:
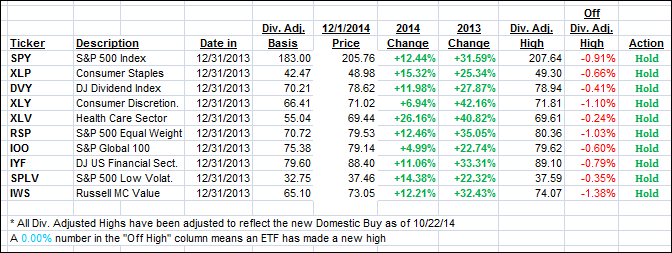
Again, the first table above shows the position of the various ETFs in relation to their respective long term trend lines (%M/A), while the second one tracks their trailing sell stops in the “Off High” column. The “Action” column will signal a “Sell” once the -7.5% point has been taken out in the “Off High” column.
3. Trend Tracking Indexes (TTIs)
Our Trend Tracking Indexes (TTIs) reversed direction and closed lower as last week’s upward momentum weakened.
Domestic TTI: +3.19% (last close +3.70%)—Buy signal since 10/22/2014
International TTI: +1.07% (last close +1.54%)—New Buy signal effective 11/24/14
Disclosure: I am obliged to inform you that I, as well as advisory clients of mine, own some of these listed ETFs. Furthermore, they do not represent a specific investment recommendation for you, they merely show which ETFs from the universe I track are falling within the guidelines specified.
Contact Ulli