
ETF/No Load Fund Tracker StatSheet
————————————————————-
THE LINK TO OUR CURRENT ETF/MUTUAL FUND STATSHEET IS:
————————————————————
Market Commentary
Friday, October 31, 2014
MARKETS TOP OFF RECORD WEEK; JAPAN ADDING STIMULUS TO ECONOMY
1. Moving the Markets
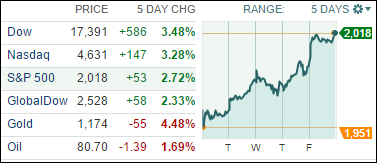
Markets finished notably higher on the week, led primarily by technology stocks. Both the S&P and Dow closed at record highs Friday, and for the week the S&P 500 finished up 2.72%, the Dow gained 3.48% and the Nasdaq rose 3.28%.
Most of the market gains today were driven by the mother of all assists via news that Japan decided to add more stimulus to its ailing economy. The country’s central bank (BofJ) announced unexpectedly it will boost asset purchases in an effort to jump-start its lagging economy and try to boost inflation, which is dangerously low. How convenient! As the Fed’s QE ended this past week another one gets started indicating to me that the global slowdown is far worse than is being admitted.
Even with gasoline prices in an apparent free-fall, Exxon Mobil (XOM) figured out a way to post strong Q3 earnings. The company said today that its profits were up 3% for the quarter thanks to a very strong performance from its refining business. Profits at the company’s refining operations, which produce chemicals and fuels, rose 38% in the quarter.
On the downside, we heard today that U.S. consumer spending fell in September, which was the first decline since January. Investors were a bit taken aback given that the spending decline followed a big 0.5% increase in August. However, economists believe September was a temporary pause as continued hiring gains will push up spending and the overall economy in coming months.
Our ETFs in the Spotlight joined this week’s party and rallied. The scary mid-October drop into bear market territory is now in the rear view mirror as a total of 3 verbal assists by Fed governor Bullard, ECB head Draghi and now the BofJ combined to make investors feel the warm fuzzies again.
2. ETFs in the Spotlight
In case you missed the announcement and description of this section, you can read it here again.
It features 10 broadly diversified ETFs from my HighVolume list as posted every Monday. Furthermore, they are screened for the lowest MaxDD% number meaning they have been showing better resistance to temporary sell offs than all others over the past year.
Here are the 10 candidates:
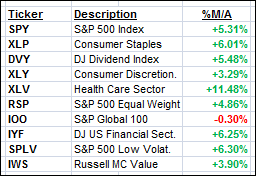
The above table simply demonstrates the magnitude with which some of the ETFs are fluctuating in regards to their positions above or below their respective individual trend lines (%M/A). A break below, represented by a negative number, shows weakness, while a break above, represented by a positive percentage, shows strength.
Year to date, here’s how the above candidates have fared so far:
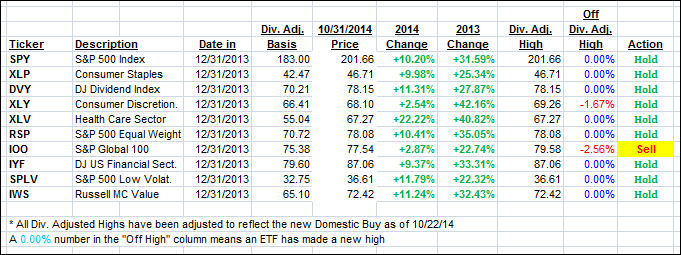
To be clear, the first table above shows the position of the various ETFs in relation to their respective long term trend lines (%M/A), while the second one tracks their trailing sell stops in the “Off High” column. The “Action” column will signal a “Sell” once the -7.5% point has been taken out in the “Off High” column.
3. Trend Tracking Indexes (TTIs)
Our Trend Tracking Indexes (TTIs) improved with the Domestic one now clearly being established on the bullish side of the line. The International one greatly improved this past week, but it remains stuck in bear market territory, although by only a fraction of a percent.
Here’s how we ended the week:
Domestic TTI: +2.93% (last Friday +1.54%)—Buy signal since 10/22/2014
International TTI: -0.39% (last Friday -2.40%)—Sell signal since 10/1/2014
Have a nice weekend.
Ulli…
Disclosure: I am obliged to inform you that I, as well as advisory clients of mine, own some of these listed ETFs. Furthermore, they do not represent a specific investment recommendation for you, they merely show which ETFs from the universe I track are falling within the guidelines specified.
————————————————————-
READER Q & A FOR THE WEEK
All Reader Q & A’s are listed at our web site!
Check it out at:
http://www.successful-investment.com/q&a.php
Reader Dennis:
Q: Ulli: Thought you may be interested in this video with Carter Worth who gives some stats on corrections of the S&P. You happen to use 7% as the point to give out corrections.
Carter, a prominent technician on Wall St, gave stats since 1927 mkt down turns. The stats showed him break points of 5% down it will go down more. He got a mean of 12% and 8.2% as median. You may consider using the power of his stats with your system. So if it goes down further from 5% perhaps use 5% as your dump or 1/2 out at 5% and 8.2% as all out to capture more of your profits. His point was its only down 7.1% as of the discussion. At one level, it may seem to avoid the whipsaws if 8.2% is the range of the bounce back. Ulli, was there a statistical reason that you picked 7% to bail?
http://video.cnbc.com/gallery/?video=3000319566&play=1
A: Dennis: I arrived at the -7% level via trial, error and experience. Remember, that 7% is a soft number. As I’ve posted before, we never put in sell stops ahead of time but use day-ending prices only. The -7% level is my alert point; if I see a break below -7.5%, I will take action the next day unless there is a rebound in the making. Via this approach, our exit point ends up being closer to -8%.
Sure, selling some assets at -5% and the balance later on, is possible. However, over the past 25 years I have found that this approach can have merits in certain environments and does not work well in others. In the end, you have to make up your own mind to decide what works best for you. In the bigger scheme of things, the goal here is to avoid going down with a bear market. There is not just one way to accomplish that.
———————————————————-
WOULD YOU LIKE TO HAVE YOUR INVESTMENTS PROFESSIONALLY MANAGED?
Do you have the time to follow our investment plans yourself? If you are a busy professional who would like to have his portfolio managed using our methodology, please contact me directly or get more details at:
https://theetfbully.com/personal-investment-management/
———————————————————
Back issues of the ETF/No Load Fund Tracker are available on the web at:
https://theetfbully.com/newsletter-archives/
Contact Ulli