
1. Moving the Markets
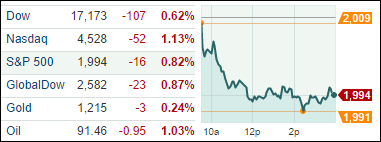
Well, the stock market did not start the week with a bang by any means. The Dow dropped 0.6% from its record close on Friday, the S&P 500 fell 0.8% and the Nasdaq plunged a whopping 1.1%. A disappointing home sales report also added to the negative tone on Wall Street today. Existing home sales broke a four-month string of gains and fell 1.8% in August.
Tech stocks took a dive today across the board and Alibaba (BABA) fell more than 4% on its second day of trading. This should not come as a big surprise though, as we have all seen enough IPOs to know that there is usually massive volatility in the weeks that follow an IPO, especially for website based companies like Facebook (FB), Twitter (TWTR) and now Alibaba. While many analysts remain bullish on Alibaba, they are not so optimistic about Yahoo! (YHOO) it seems. Yahoo, which holds a 22% stake in Alibaba, lost 5.6% to $38.65 after dropping nearly 3% Friday.
In M&A news, we heard today that Germany’s Merck (MRK) is planning on buying the chemical firm Sigma Aldrich (SIAL) for $17 billion. Sigma’s stock jumped up about 33% today to end at $134.40.
All of our 10 ETFs in the Spotlight joined the major indexes and headed south to varying degrees.
2. ETFs in the Spotlight
In case you missed the announcement and description of this section, you can read it here again.
It features 10 broadly diversified ETFs from my HighVolume list as posted every Monday. Furthermore, they are screened for the lowest MaxDD% number meaning they have been showing better resistance to temporary sell offs than all others over the past year.
Here are the 10 candidates:
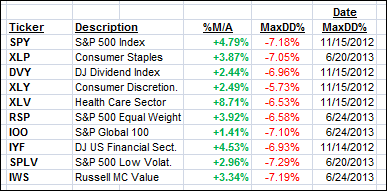
All of them are currently in “buy” mode, meaning their prices are above their respective long term trend lines by the percentage indicated (%M/A).
Year to date, here’s how the above candidates have fared so far:
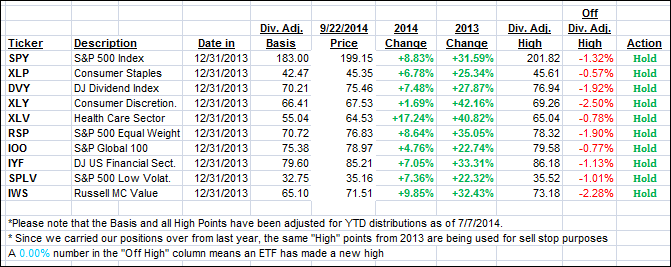
To be clear, the first table above shows the position of the various ETFs in relation to their respective long term trend lines (%M/A), while the second one tracks their trailing sell stops in the “Off High” column. The “Action” column will signal a “Sell” once the -7.5% point is taken out in the “Off High” column.
3. Domestic Trend Tracking Indexes (TTIs)
Our Trend Tracking Indexes (TTIs) pulled back with the International one taking the big hit:
Domestic TTI: +1.93% (last close +2.37%)
International TTI: +0.89% (last close day +1.66%)
Disclosure: I am obliged to inform you that I, as well as advisory clients of mine, own some of these listed ETFs. Furthermore, they do not represent a specific investment recommendation for you, they merely show which ETFs from the universe I track are falling within the guidelines specified.
Contact Ulli