
1. Moving the Markets
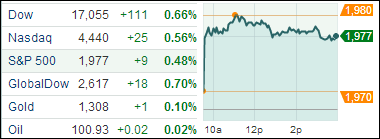
Stocks kicked off this week on a high note as the markets rocketed higher with the Dow once again passing the 17,000 mark to close at 17,055. In general, investors were encouraged by a slew of M&A activity alongside better than expected earnings from Citigroup. All major indexes gained as the chart shows.
In M&A news, Shares of drug maker Mylan (MYL) jumped 2% to $51.24 after the company announced it will buy Abbott Laboratories’ (ABT) generic-drugs business in developed markets for stock valued at about $5.3 billion. Abbott gained 1.3% to $41.82.
Also in pharmaceutical M&A news, AbbVie (ABBV), maker of the arthritis drug Humira, offered over the weekend to pay cash and stock equal to about $91.10 a share for Shire (SHPG), maker of the attention deficit hyperactivity disorder drugs Vyvanse and Adderal XR. Its latest offer exceeded its prior one of $51 billion.
This is a great start to the week, and with the market trading near all-time highs, investors will be focused on a large number of corporate earnings coming down the pipeline, including quarterly reports from General Electric (GE), Google (GOOG), Bank of America (BAC) and Johnson & Johnson (JNJ).
Our 10 ETFs in the Spotlight rallied with the indexes with 2 of them reaching new highs.
2. ETFs in the Spotlight
In case you missed the announcement and description of this section, you can read it here again.
It features 10 broadly diversified ETFs from my HighVolume list as posted every Monday. Furthermore, they are screened for the lowest MaxDD% number meaning they have been showing better resistance to temporary sell offs than all others over the past year.
Here are the 10 candidates:
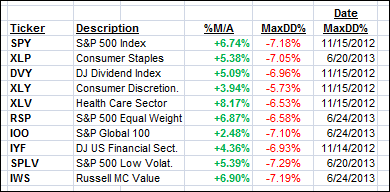
All of them are in “buy” mode, meaning their prices are above their respective long term trend lines by the percentage indicated (%M/A).
Year to date, here’s how the above candidates have fared so far:
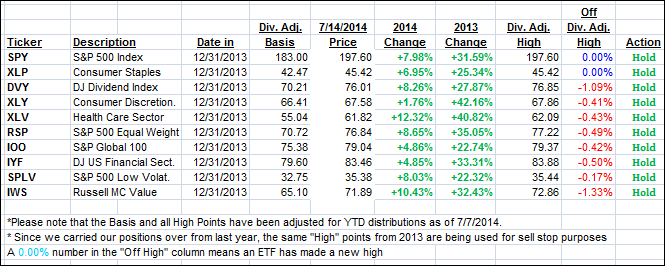
To be clear, the first table above shows the position of the various ETFs in relation to their respective long term trend lines (%M/A), while the second one tracks their trailing sell stops in the “Off High” column. The “Action” column will signal a “Sell” once the -7.5% point is taken out in the “Off High” column.
3. Domestic Trend Tracking Indexes (TTIs)
Our Trend Tracking Indexes (TTIs) followed the positive bias and closed up:
Domestic TTI: +3.33% (last close +3.05%)
International TTI: +3.64% (last close +3.05%)
Disclosure: I am obliged to inform you that I, as well as advisory clients of mine, own some of these listed ETFs. Furthermore, they do not represent a specific investment recommendation for you, they merely show which ETFs from the universe I track are falling within the guidelines specified.
Contact Ulli