
1. Moving The Markets
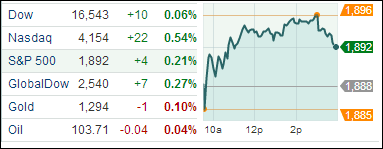
The stock market opened full steam ahead on Thursday and showed no signs of a pullback. The Nasdaq led index gains today up 0.55%, while the S&P rose 0.21% and the Dow squeezed out a 0.06% increase. The Nasdaq was propelled upwards today by a surge in biotech stocks. The Nasdaq biotech index (^NBI) showed a 1.9% increase, as notable ‘momentum’ names like Vertex Pharmaceuticals (VRTX) and Alexion (ALXN) posted substantial gains.
Among the biggest variables influencing the markets this year have been uncertainty over when U.S. growth will accelerate and concern that China’s growth is slowing. Well, we received an update today that China’s manufacturing contraction eased in May, as HSBC’s preliminary purchasing managers’ index rose to 49.7 from 48.1 in April. Numbers above 50 on the 100-point scale indicate expansion.
Elsewhere on the earnings front, electronics seller Best Buy (BBY) says its quarterly earnings were $1.31 per share, a turnaround from a loss of 24 cents per share a year earlier. Positive earnings announcements from Dollar Tree (DLTR) and other retailers also helped lift the market higher today.
Our 10 ETFs in the Spotlight edged up as well with 9 of them showing green numbers YTD.
2. ETFs in the Spotlight
In case you missed the announcement and description of this section, you can read it here again.
It features 10 broadly diversified ETFs from my HighVolume list as posted every Monday. Furthermore, they are screened for the lowest MaxDD% number meaning they have been showing better resistance to temporary sell offs than all others over the past year.
In other words, none of them ever triggered their 7.5% sell stop level during this time period, which included a variety of severe market pullbacks but no move into outright bear market territory.
Here are the 10 candidates:
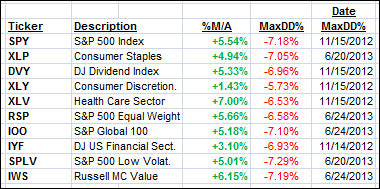
All of them, are in “buy” mode, meaning their prices are above their respective long term trend lines by the percentage indicated (%M/A).
Year to date, here’s how the above candidates have fared so far:
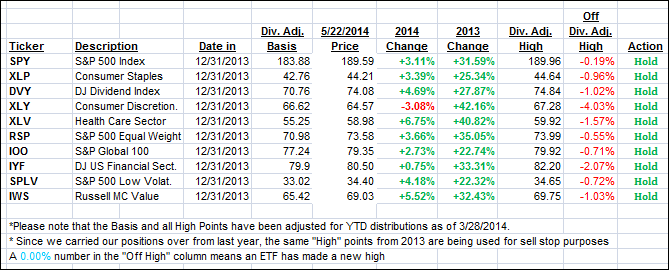
To be clear, the first table above shows the position of the various ETFs in relation to their respective long term trend lines (%M/A), while the second one tracks their trailing sell stops in the “Off High” column. The “Action” column will signal a “Sell” once the -7.5% point is taken out in the “Off High” column.
3. Domestic Trend Tracking Indexes (TTIs)
Our Trend Tracking Indexes (TTIs) improved and headed north. Here’s how we closed the day:
Domestic TTI: +2.61% (last close +2.40%)
International TTI: +3.68% (last close +3.39%)
Disclosure: I am obliged to inform you that I, as well as advisory clients of mine, own some of these listed ETFs. Furthermore, they do not represent a specific investment recommendation for you, they merely show which ETFs from the universe I track are falling within the guidelines specified.
Contact Ulli