
ETF/No Load Fund Tracker StatSheet
————————————————————-
THE LINK TO OUR CURRENT ETF/MUTUAL FUND STATSHEET IS:
————————————————————
Market Commentary
Friday, April 25, 2014
POSITIVE CORPORATE EARNINGS, INTERNATIONAL TENSIONS LEAVE MARKETS MIXED FOR THE WEEK
1. Moving The Markets
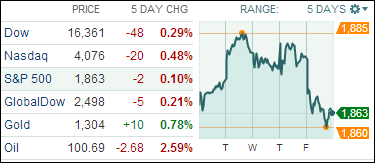
Stocks were little changed on the week, as the Ukrainian-Russian conflict came back into focus lover the past few days, ending a six-day winning streak. After the slight pullback in early April, the S&P 500 is up about 1% on the year and just 1% below record highs as markets continue to receive support from some improving economic data points and better-than-expected earnings reports.
The major indexes ended the week lower as the above 5-day chart shows.
We saw a mix of positive and negative reports on the economic front this week. Durable goods orders rose strongly, up 2.6% in March from February. This was better than expected and the strongest increase in four months. US consumer confidence rose in the period ended April 20th to its second-strongest level since January 2008. However, new home sales fell sharply, down 14.5% in March from February to the slowest pace since last July, and the number of US initial jobless claims rose by 24,000 to a seasonally adjusted 329,000.
It will be an extremely full upcoming week for economic data and the busiest for first-quarter earnings season. Highlights include the initial reading of first-quarter gross domestic product (GDP) and an interest rate decision by the Federal Reserve (including potential further tapering of bond purchases). If corporate earnings trends continue to top analyst estimates, as they have over the past two weeks, markets should react positively and continue trending upwards.
Our 10 ETFs in the Spotlight offered a mixed picture with 2 of them making new highs today while 8 of them are remaining in the green YTD.
2. ETFs in the Spotlight
In case you missed the announcement and description of this section, you can read it here again.
It features 10 broadly diversified ETFs from my HighVolume list as posted every Monday. Furthermore, they are screened for the lowest MaxDD% number meaning they have been showing better resistance to temporary sell offs than all others over the past year.
In other words, none of them ever triggered their 7.5% sell stop level during this time period, which included a variety of severe market pullbacks but no move into outright bear market territory.
Here are the 10 candidates:
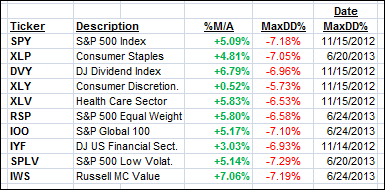
All of them are in “buy” mode, meaning their prices are above their respective long term trend lines by the percentage indicated (%M/A).
Year to date, here’s how the above candidates have fared so far:
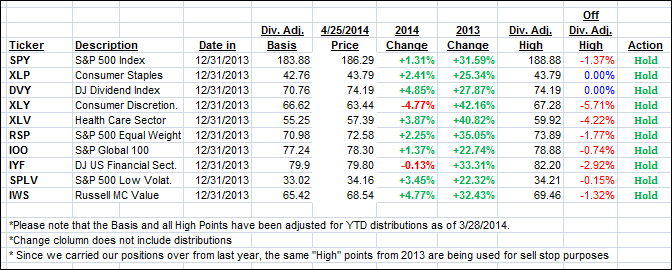
To be clear, the first table above shows the position of the various ETFs in relation to their respective long term trend lines (%M/A), while the second one tracks their trailing sell stops in the “Off High” column. The “Action” column will signal a “Sell” once the -7.5% point is taken out in the “Off High” column.
3. Domestic Trend Tracking Indexes (TTIs)
Our Trend Tracking Indexes (TTIs) slipped and but remain above their respective long-term trend lines by the following percentages:
Domestic TTI: +1.86% (last Friday +2.26%)
International TTI: +2.74% (last Friday +3.20%)
Have a great week.
Ulli…
Disclosure: I am obliged to inform you that I, as well as advisory clients of mine, own some of these listed ETFs. Furthermore, they do not represent a specific investment recommendation for you, they merely show which ETFs from the universe I track are falling within the guidelines specified.
————————————————————-
READER Q & A FOR THE WEEK
All Reader Q & A’s are listed at our web site!
Check it out at:
http://www.successful-investment.com/q&a.php
A note from reader Don:
Q: Ulli: When I subtract the dividend for an ETF from the high close for sell stop purposes, the sell stop is sometimes considerably less than it would be if I deducted the 7.5% from the high close. Am I right to use the high close less the dividends to compute the sell stop?
A: Don: Yes, when the price of an ETF is reduced by the amount of the dividend paid, you need to adjust the former high price by the same amount. Otherwise, your sell stop discipline is out of whack.
———————————————————-
WOULD YOU LIKE TO HAVE YOUR INVESTMENTS PROFESSIONALLY MANAGED?
Do you have the time to follow our investment plans yourself? If you are a busy professional who would like to have his portfolio managed using our methodology, please contact me directly or get more details at:
https://theetfbully.com/personal-investment-management/
———————————————————
Back issues of the ETF/No Load Fund Tracker are available on the web at:
https://theetfbully.com/newsletter-archives/
Contact Ulli