

1. Moving The Markets
Volatility seems to be the name of the game so far in 2014. One day the markets are down, the next they bounce back only to fall again the day after. All of the major U.S. indices closed in the red today after a private survey showed that U.S. businesses added jobs at a steady but modest pace in January. Investors are also looking to a key government report on job growth on Friday, as many investors remain leery, waiting to see if upcoming economic reports and company earnings will show that the U.S. economic recovery is on track.
Despite Wednesday’s overall decline in the market, many stocks finished in the green. Walgreens (WAG) was amongst the top performers of the S&P, gaining 3.4%. TJ Max (TJX) was not far behind, gaining 3.1%. If you like gambling (on other things besides stocks) you may have taken note of the casino stocks that were in the news today. Las Vegas Sands (LVS), Wynn Resorts (WYNN) and MGM Resorts International (MGM) all dropped today as a reaction to the disappointing gambling revenue numbers that came out of Macau. Apparently, there was significantly less gambling throughout the lunar New Year holiday.
While not making major news today, gold still remains a topic of interest as the markets continue to be unpredictable. The Market Vectors Junior Gold Miners ETF (GDXJ) has gained an impressive 16% this year, a remarkable comeback from last year’s 61% plunge. The Market Vectors Gold Miners ETF (GDX), tracking large-cap miners, has bounced back 10% this year from a 54% nose-dive last year and the SPDR Gold Trust (GLD), the largest ETF tracking gold bullion, with $32 billion in assets, has gained 4% year to date after losing 28% in 2013.
Our 10 ETFs in the Spotlight meandered with 4 of them now hovering below their respective long-term trend lines.
2. ETFs in the Spotlight
In case you missed the announcement and description of this section, you can read it here again.
It features 10 broadly diversified ETFs from my HighVolume list as posted every Monday. Furthermore, they are screened for the lowest MaxDD% number meaning they have been showing better resistance to temporary sell offs than all others over the past year.
In other words, none of them ever triggered their 7.5% sell stop level during this time period, which included a variety of severe market pullbacks but no move into outright bear market territory.
Here are the 10 candidates:
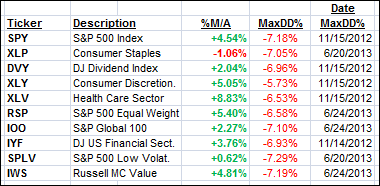
6 of them remain in “buy” mode meaning their prices are above their respective long term trend lines by the percentage indicated (%M/A).
Year to date, here’s how the above candidates have fared so far:
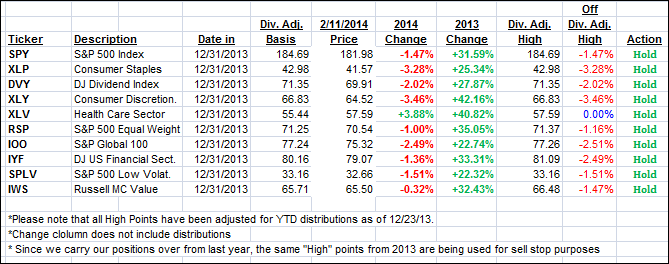
Keep in mind that the first table above shows the position of the various ETFs in relation to their respective long term trend lines (%M/A) while the second one tracks their trailing sell stops in the “Off High” column.
3. Domestic Trend Tracking Indexes (TTIs)
Our Trend Tracking Indexes (TTIs) showed a mixed picture today as the Domestic one declined slighlty while the Internatiuonal one headed higher:
Domestic TTI: +1.31% (last close +1.45%)
International TTI: +1.90% (last close +1.70%)
Contact Ulli
Comments 2
Hi Ulli. Now that four of your ETFs have fallen below their long term trend lines, have you sold them? If not, will they be sold tomorrow? I didn’t see any mention of any action you may have taken now that those trend lines have been broken.
Thanks
Hi Ulli, I know you follow your own trend lines, which are still slightly positive, but I was thinking it might be fun for you to write about Tom Demark’s prediction, which calls for a 40% drop soon:
http://video.cnbc.com/gallery/?video=3000242307&play=1
Thanks for all you do,
Mel