
ETF/No Load Fund Tracker StatSheet
————————————————————-
THE LINK TO OUR CURRENT ETF/MUTUAL FUND STATSHEET IS:
https://theetfbully.com/2013/12/10644/
————————————————————
Market Commentary
Friday, December 20, 2013
OVERALL, INVESTORS SATISFIED WITH FOMC DECISION
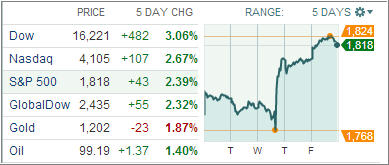
1. Moving The Markets
An eventful week has come to its end, and the markets are rather satisfied with the FOMC decision to modestly start tapering its monthly bond purchases by January 2014. The US dollar was stronger across the board, while the price action is smooth despite lower liquidities before the year-end holidays. The 10-year US treasuries stepped up to 2.92% – 2.95% range in New York yesterday, while the tension in emerging markets rises alongside with the higher US yields.
Bitcoin got slammed this week. No surprise there. It is in competition with the U.S. dollar, Yuan and the Euro. What is a surprise is the revelation on Bloomberg that the London Gold vaults are “virtually empty.” Where’s the gold now? China. There really is a finite amount of gold.
The Fed’s tapering decision is going over well in Europe exchange traded funds, with European stocks gaining for the third consecutive day and moving on their best weekly performance since April. The Vanguard FTSE Europe ETF (VGK) is up 1.9% since the Fed announcement Wednesday.
Half of our ETFs in the spotlight made new highs today, the other half has pulled back slightly.
2. ETFs in the Spotlight
In case you missed the announcement and description of this section, you can read it here again.
It features 10 broadly diversified ETFs from my HighVolume list as posted every Monday. Furthermore, they are screened for the lowest MaxDD% number meaning they have been showing better resistance to temporary sell offs than all others over the past year.
In other words, none of them ever triggered their 7.5% sell stop level during this time period, which included a variety of severe market pullbacks but no move into outright bear market territory.
Here are the 10 candidates:
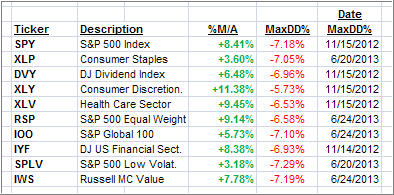
All of them are in “buy” mode meaning their prices are above their respective long term trend lines by the percentage indicated (%M/A).
Now let’s look at the MaxDD% column and review the ETF with the lowest drawdown as an example. As you can see, that would be XLY with the lowest MaxDD% number of -5.73%, which occurred on 11/15/2012.
The recent sell off in the month of June did not affect XLY at all as its “worst” MaxDD% of -5.73% still stands since the November 2012 sell off.
A quick glance at the last column showing the date of occurrences confirms that five of these ETFs had their worst drawdown in November 2012, while the other five were affected by the June 2013 swoon, however, none of them dipped below their -7.5% sell stop.
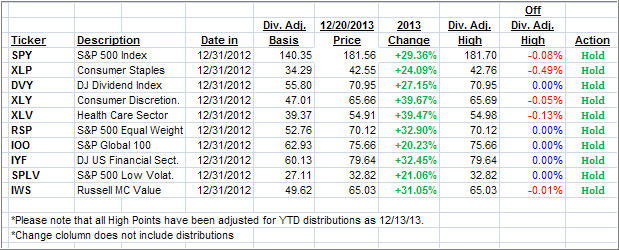
Year to date, here’s how the above candidates have fared so far:
3. Domestic Trend Tracking Indexes (TTIs)
Our Trend Tracking Indexes (TTIs) advanced with the overall positive tone in the market and remain above their long term trend lines by the following percentages:
Domestic TTI: +4.31% (last Friday +3.31%)
International TTI: +5.95% (last Friday +4.45%)
Have a great week.
Ulli…
Disclosure: I am obliged to inform you that I, as well as advisory clients of mine, own some of these listed ETFs. Furthermore, they do not represent a specific investment recommendation for you, they merely show which ETFs from the universe I track are falling within the guidelines specified.
————————————————————-
READER Q & A FOR THE WEEK
All Reader Q & A’s are listed at our web site!
Check it out at:
http://www.successful-investment.com/q&a.php
A note from reader Jack:
Q: Ulli: I like your new format the daily market commentary.
Will you continue showing these ETFs in the spotlight new year?
A: Jack: Yes, I will update these 10 ETFs every day along with a continuation of their “High” points and 2014 YTD figures in a newly added “Change” column.
Keep in mind that a new year does not change any of the calculations in regards to determining the trailing sell stop points. Of course, I need to point out that you may have different “High” points depending on your purchase date of the ETFs.
———————————————————-
WOULD YOU LIKE TO HAVE YOUR INVESTMENTS PROFESSIONALLY MANAGED?
Do you have the time to follow our investment plans yourself? If you are a busy professional who would like to have his portfolio managed using our methodology, please contact me directly or get more details at:
https://theetfbully.com/personal-investment-management/
———————————————————
Back issues of the ETF/No Load Fund Tracker are available on the web at:
https://theetfbully.com/newsletter-archives/
Contact Ulli