
1. Moving The Markets
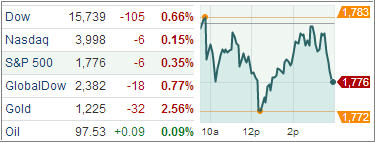
Stocks extended losses in choppy trading amid mixed retailer sales and jobs data. In the tech world, Oracle (ORCL) stock slipped Thursday after the database leader was downgraded by Morgan Stanley and RBC Capital on valuation, worries over China’s IT spending and growing competition from cloud computing vendors. Facebook (FB) popped 5% and closed back above the 50 level in hefty trade. The stock hit a one-month high in reaction to late Wednesday’s news that it’s being added to the S&P 500.
The number of new weekly jobless claims recently reached the highest level in two months, according to government data released Thursday. The number of initial claims for unemployment benefits rose by 68,000 in the week that ended Dec. 7 to 368,000, above a consensus forecast of 335,000, according to U.S. Labor Department data. Although data during the holidays can be tough to analyze, trends indicate that jobless claims, a proxy for layoffs, are low, and that workers are gaining confidence in the labor market. Overall, the government’s recent employment report signaled that jobs have rebounded from a summer slump.
In ETF news today, Vanguard launched the Vanguard Global Minimum Volatility Fund, which offers two low-cost share classes—Investor Shares and Admiral Shares. Unlike a traditional active fund that seeks to outperform the market on an absolute basis, this fund is constructed to offer broad market exposure with a lower degree of share price fluctuations.
In robotics, ROBO-STOX LLC, the world leader in developing investment solutions targeting the robotics and automation space, has announced that the ROBO-STOX Global Robotics and Automation Index ETF (ROBO) amassed more than $25 million in assets under management as of November 30, 2013.
All of our ETFs in the Spotlight headed lower with consumer staples taking the lead after bucking the trend yesterday.
2. ETFs in the Spotlight
In case you missed the announcement and description of this section, you can read it here again.
It features 10 broadly diversified ETFs from my HighVolume list as posted every Monday. Furthermore, they are screened for the lowest MaxDD% number meaning they have been showing better resistance to temporary sell offs than all others over the past year.
In other words, none of them ever triggered their 7.5% sell stop level during this time period, which included a variety of severe market pullbacks but no move into outright bear market territory.
Here are the 10 candidates:
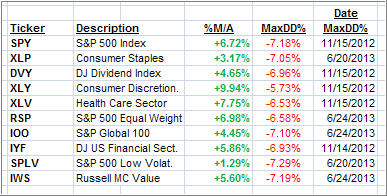
All of them are in “buy” mode meaning their prices are above their respective long term trend lines by the percentage indicated (%M/A).
Now let’s look at the MaxDD% column and review the ETF with the lowest drawdown as an example. As you can see, that would be XLY with the lowest MaxDD% number of -5.73%, which occurred on 11/15/2012.
The recent sell off in the month of June did not affect XLY at all as its “worst” MaxDD% of -5.73% still stands since the November 2012 sell off.
A quick glance at the last column showing the date of occurrences confirms that five of these ETFs had their worst drawdown in November 2012, while the other five were affected by the June 2013 swoon, however, none of them dipped below their -7.5% sell stop.
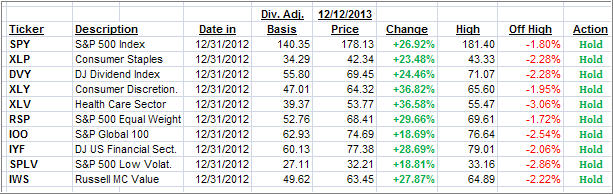
Year to date, here’s how the above candidates have fared so far:
3. Domestic Trend Tracking Indexes (TTIs)
Trend wise, our Trend Tracking Indexes (TTIs) headed south but remain on the bullish side of the long-term trend line:
Domestic TTI: +3.41% (last close +3.65%)
International TTI: +4.63% (last close +5.21%)
Disclosure: I am obliged to inform you that I, as well as advisory clients of mine, own some of these listed ETFs. Furthermore, they do not represent a specific investment recommendation for you, they merely show which ETFs from the universe I track are falling within the guidelines specified.
Contact Ulli