
1. Moving The Markets
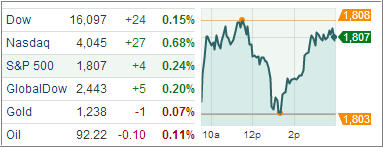
Stockholders have plenty to be thankful for this Thanksgiving. And the day before the holiday gave them even more reason to be pleased. Both the Dow and S&P pushed into record territory yet again. At the same time, the Nasdaq hit its highest level since the tech bubble 13 years ago. Hewlett-Packard (HPQ) led the push by climbing more than 9% after its earnings announcement.
On the economic front there was more reason to celebrate. The Labor Department says there were 316,000 new jobless claims filed last week. That was below the 330,000 which were expected. Meanwhile, a separate report showed durable goods orders fell 2% in October when expectations had been for a drop of 2.2%.
Iran and world powers entered into a preliminary six-month accord in which Iran would curb its nuclear activities in exchange for easing international sanctions on oil, auto parts, gold and precious metals. If sanctions are lifted on Iran, it would add one million barrels per day of oil to world markets by next year and improve long-term oil supply conditions. The mixed sentiment has put oil ETFs in focus for the coming weeks. These ETFs might be easier plays for investors than trying to deal directly in the futures market.
Here is the latest update of our ETFs in the Spotlight:
2. ETFs in the Spotlight
In case you missed the announcement and description of this section, you can read it here again.
It features 10 broadly diversified ETFs from my HighVolume list as posted every Monday. Furthermore, they are screened for the lowest MaxDD% number meaning they have been showing better resistance to temporary sell offs than all others over the past year.
In other words, none of them ever triggered their 7.5% sell stop levels during this time period, which included a variety of severe market pullbacks but no move into outright bear market territory.
Here are the 10 candidates:
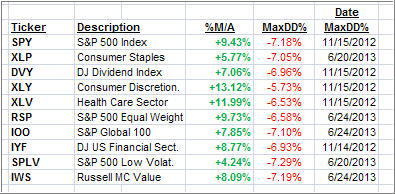
All of them are in “buy” mode meaning their prices are above their respective long term trend lines by the percentage indicated (%M/A).
Now let’s look at the MaxDD% column and review the ETF with the lowest drawdown as an example. As you can see, that would be XLY with the lowest MaxDD% number of -5.73%, which occurred on 11/15/2012.
The recent sell off in the month of June did not affect XLY at all as its “worst” MaxDD% of -5.73% still stands since the November 2012 sell off.
A quick glance at the last column showing the date of occurrences confirms that five of these ETFs had their worst drawdown in November 2012, while the other five were affected by the June 2013 swoon, however, none of them dipped below their -7.5% sell stop.
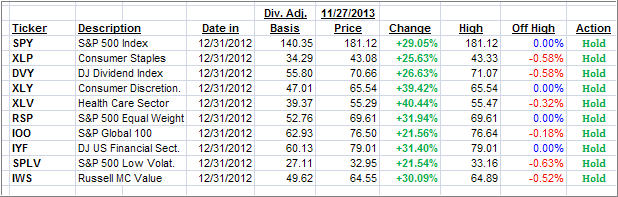
Year to date, here’s how the above candidates have fared so far:
3. Domestic Trend Tracking Indexes (TTIs)
Trend wise, our Trend Tracking Indexes (TTIs) both edged higher and are currently positioned above their respective long term ternd lines by the following percentages:
Domestic TTI: +5.06% (last close +4.97%)
International TTI: +7.64% (last close +7.52%)
Disclosure: I am obliged to inform you that I, as well as advisory clients of mine, own some of these listed ETFs. Furthermore, they do not represent a specific investment recommendation for you, they merely show which ETFs from the universe I track are falling within the guidelines specified.
Contact Ulli