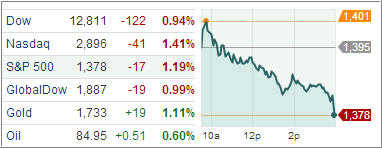
The equity markets picked up where they left off yesterday and continued with their best imitation of a black diamond ski slope as the major averages got crushed for the second day in a row. Many traders had expected some kind of a rebound after Wednesday’s thrashing but, other than a quick peek higher after the open, it was all downhill.
To add insult to injury, not only did the S&P 500 imitate a perfect swan dive into the close, it also took out its psychologically important 200-day moving average of 1,380. It pierced through that level for the first time in 5 months even though by only a couple of points; however, closing at the low for the day is usually a sign of more weakness to come.
The Dow Industrials and the Nasdaq had already crossed their respective 200-day averages and are now stuck on the bearish side of their trend lines.
It’s no secret what was behind the sell off.
While all eyes had been focused on the election for most of this year, I have pointed out from time to time certain realities have simply been ignored, and they are now coming back to haunt the markets.
The big worry is that if no deal is reached in Congress the fiscal cliff will strike the economy with all of its might as some $600 billion in spending cuts and tax increases are sure to push us ‘officially’ into a recession.
Then there is the upcoming debt ceiling debacle and the never ending European crisis, which can at anytime blow sky high and accelerate any market downturns. It is therefore imperative that you follow my recommended sell stop discipline and head for the sidelines when prompted to do so.
Our Trend Tracking Indexes (TTIs) moved closer to their trend lines, but a break did not yet occur. Here’s how we ended the day:
Domestic TTI: +0.71%
International TTI: +1.39%
Any more downward momentum will either trigger our trailing sell stops for our equity holdings or push our Domestic TTI into bear market territory. Either way, that action will prompt us to liquidate any equity ETFs/mutual funds for the time being. Stay tuned for the latest updates.
For quick access to the most recent StatSheet including TTI charts and all momentum figures, click here. You can read the latest ETF Model Portfolio update here.
Contact Ulli

Comments 3
I am glad you put more emphasis on per cent than points or dollars. I have a fairly good understanding of arithmetic but it is hard to compare points in the Dow 30 with points in the S&P 500. They are easy to compare using percentages.
Dear Ulli,
I just want to thank you for all that you provide with your website and newsletters. By educating me about momentum and sell stops and by providing your weekly stat sheets of funds, you have made me feel empowered and protected when it comes to investing. Your balanced approach is so much more reasonable and refreshing than that of the euphoric bubble prone bulls or the doom and gloom bears. Providing a method and a discipline for stepping in and out of the market, really helps me to sleep better at night. I have used your method 4 times already this year. Three for gains and once with a minor loss. The current downhill trend has already pushed me to sell two of my funds and if the downward momentum continues, I am ready to pull the trigger and step to the sidelines. If only I had discovered you before 2008, my retirement years would likely be much more secure. God bless you Ulli, and thanks again.
Don
Don,
Thank you for your kind words. I appreciate that you see value in my efforts.
Ulli…