
- Moving the market
Stocks received an early boost after Disney reported an unexpected jump in streaming subscribers, pushing its stock up by 10%.
Adding to the early bullish sentiment was news that Treasury Secretary Bessent and a top trade official will meet their Chinese counterparts this week in Switzerland. Traders viewed this as a potential de-escalation on the trade front, which had previously caused chaotic market action.
Later in the day, the Federal Reserve’s decision on interest rates was highly anticipated, with nearly 100% certainty that the bank would hold rates steady. Equally important was Fed Chair Powell’s press conference, which provided further insights into the direction of interest rates.
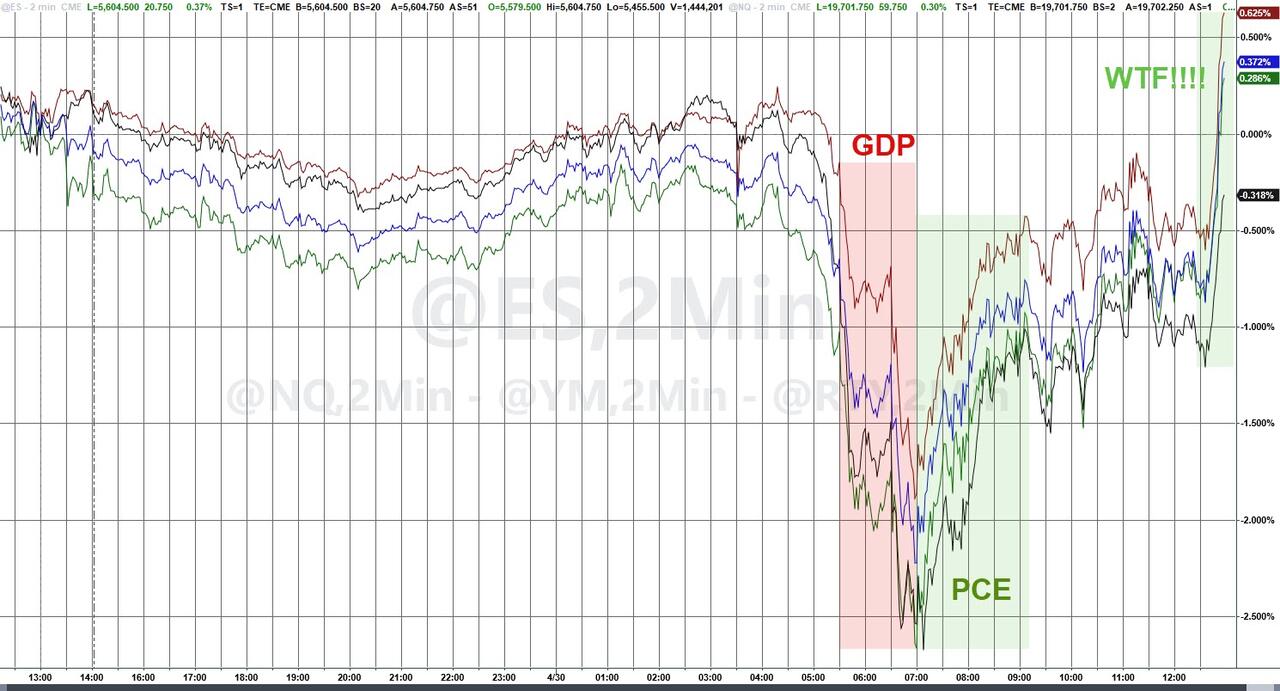
Today’s session was choppy, with major indexes fluctuating due to various headlines. Positive news included scheduled China trade talks for Sunday and Trump’s announcement to rescind global chip curbs. Negative news involved Apple considering replacing the Google search engine and Trump’s refusal to preemptively lower China’s tariffs.
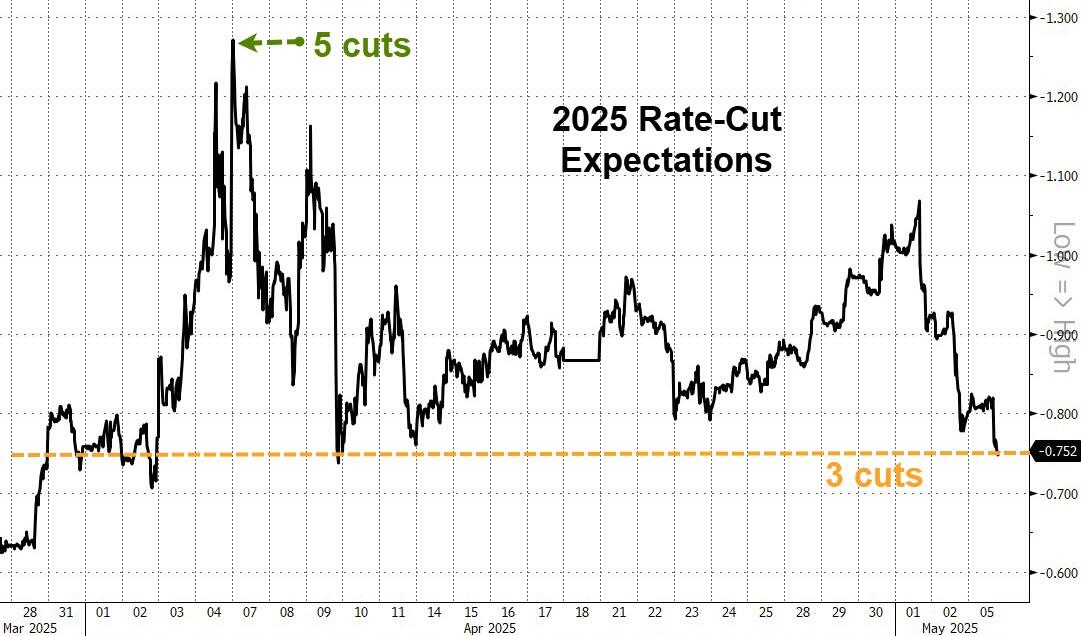
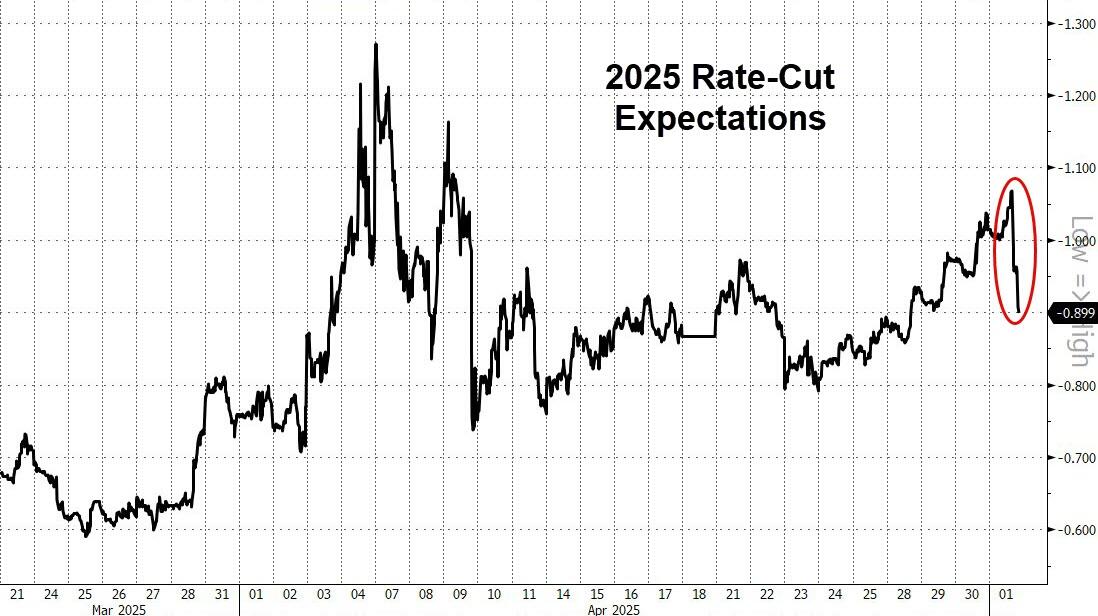
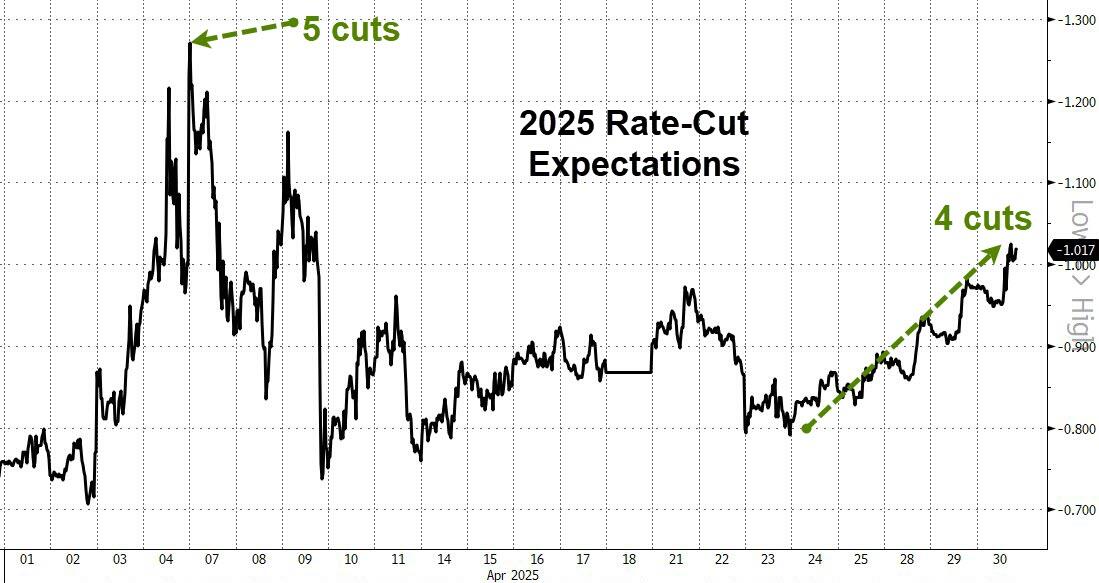
As expected, the Fed held rates steady, and Powell’s press conference was summarized by one economist as a “nothingburger,” with rate-cut expectations slipping. Powell highlighted several key points:
– Inflationary effects of policies could be short-lived.
– Uncertainty about the path of the economy is extremely elevated.
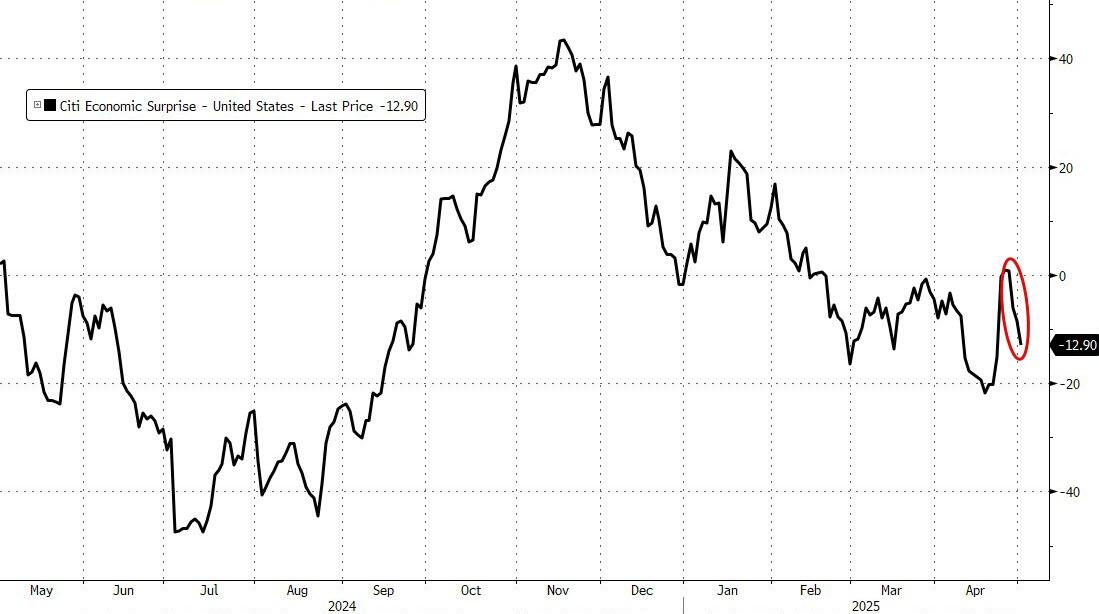
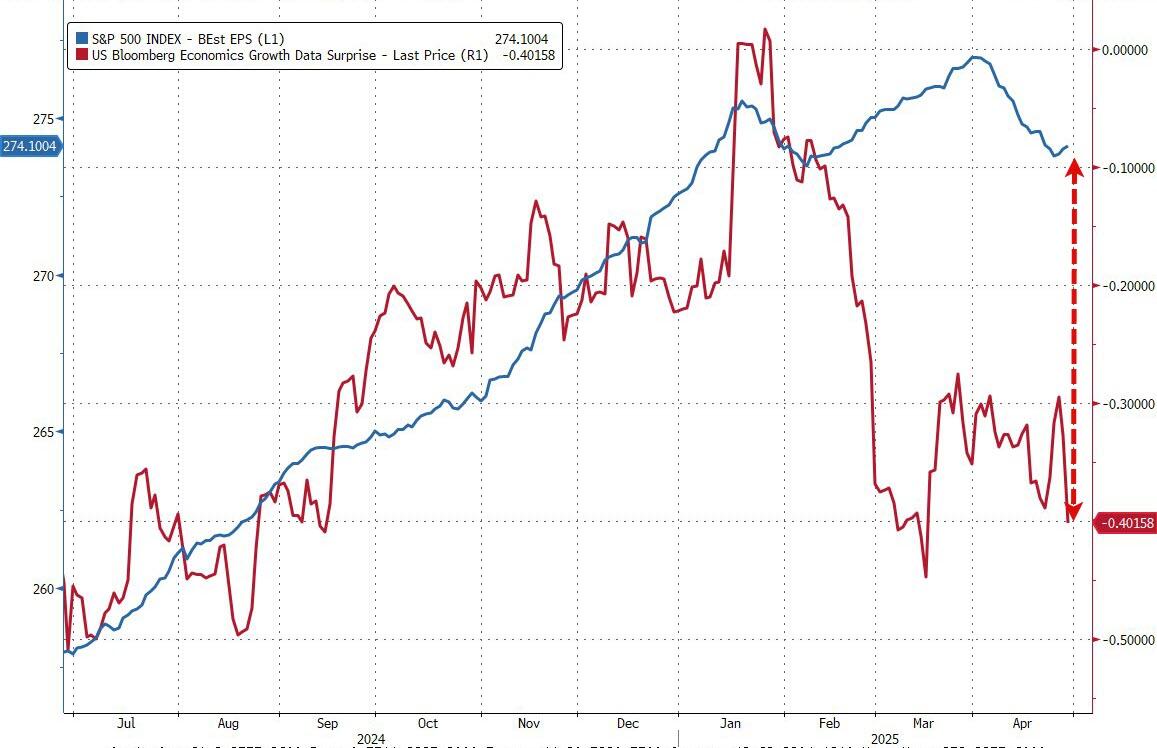
– No slowdown is evident in actual economic data yet.
– Costs of waiting are fairly low.
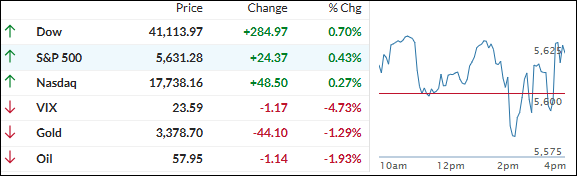
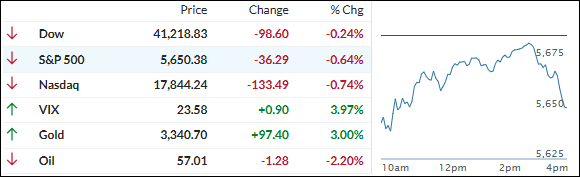
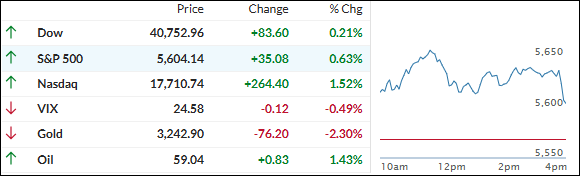
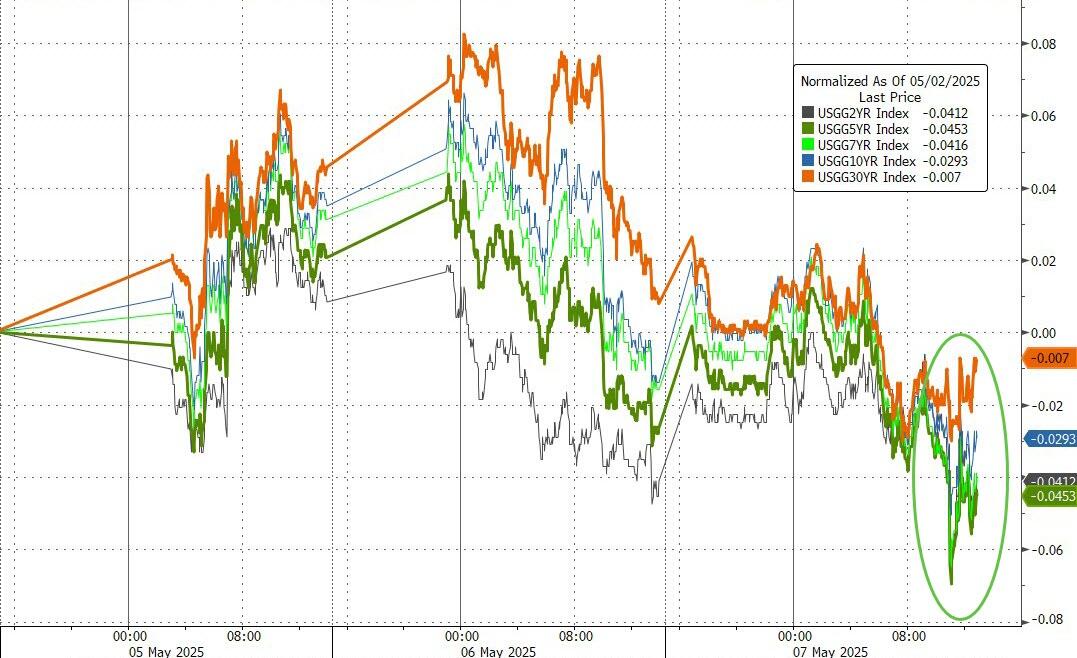
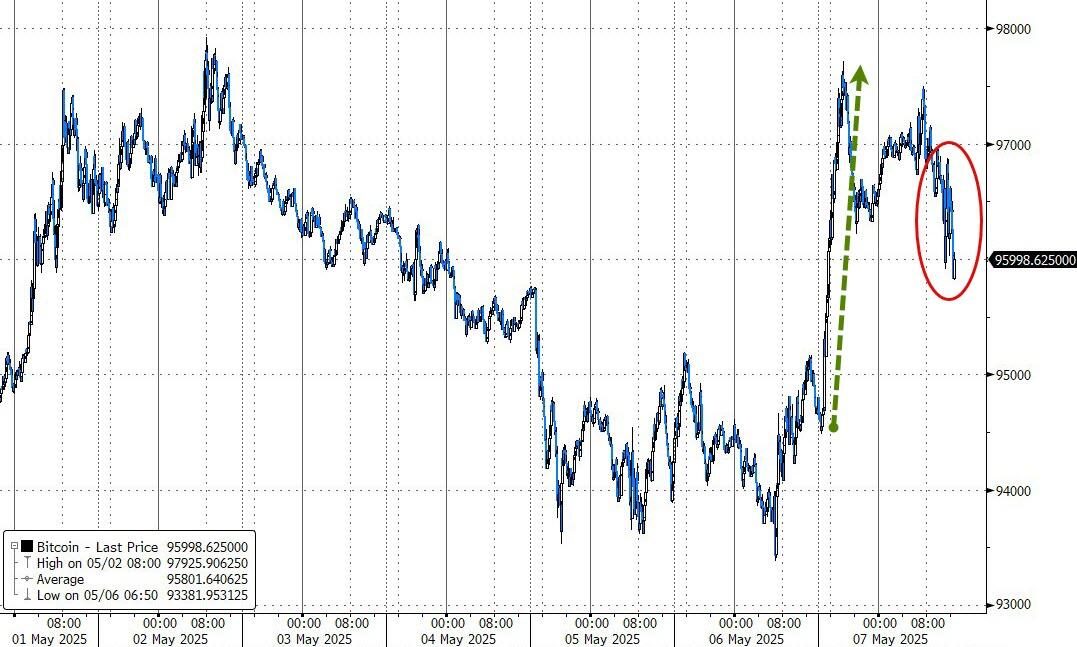
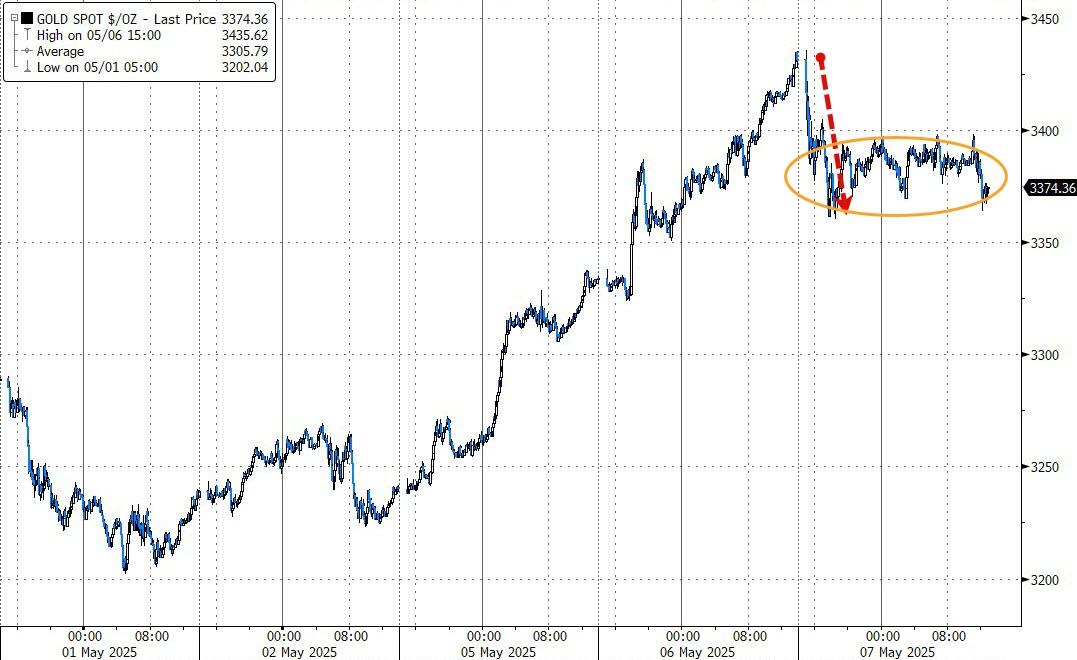
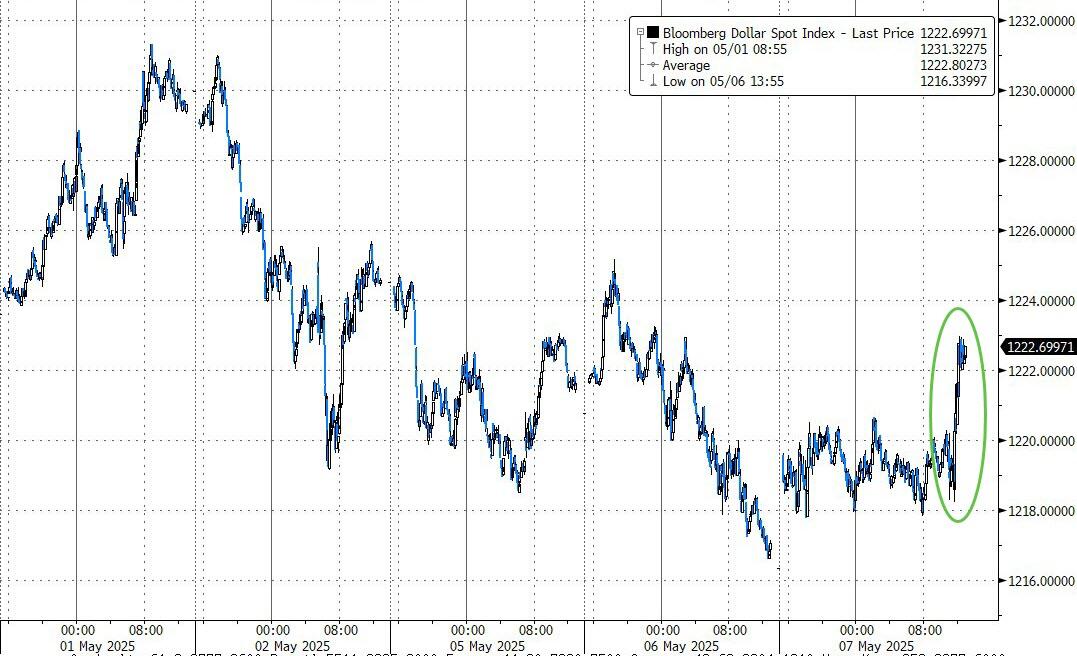
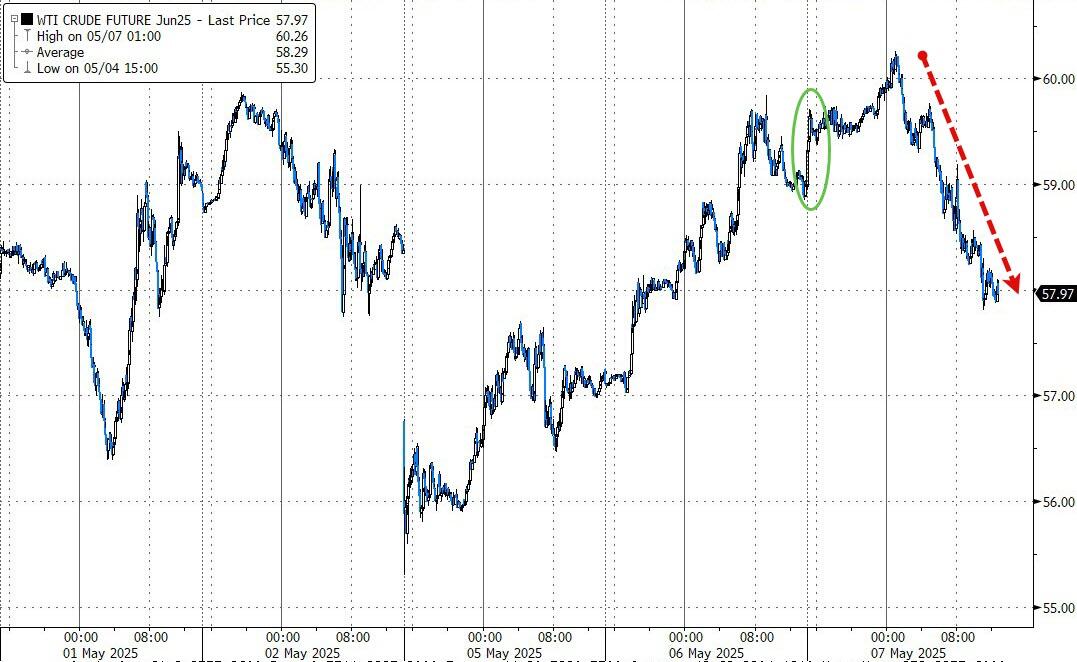
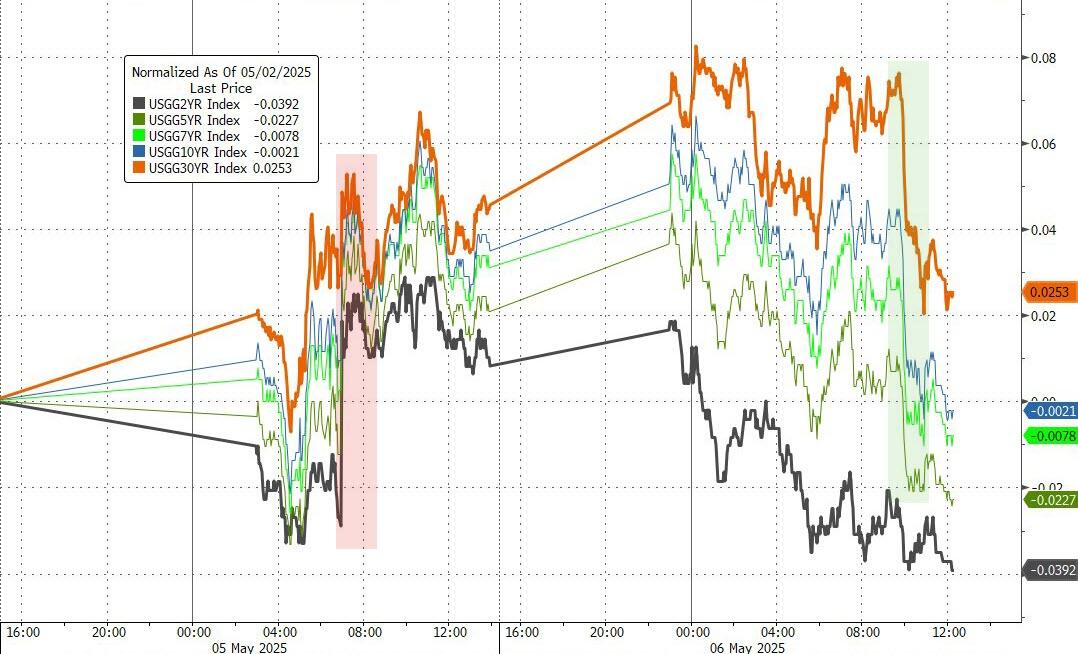
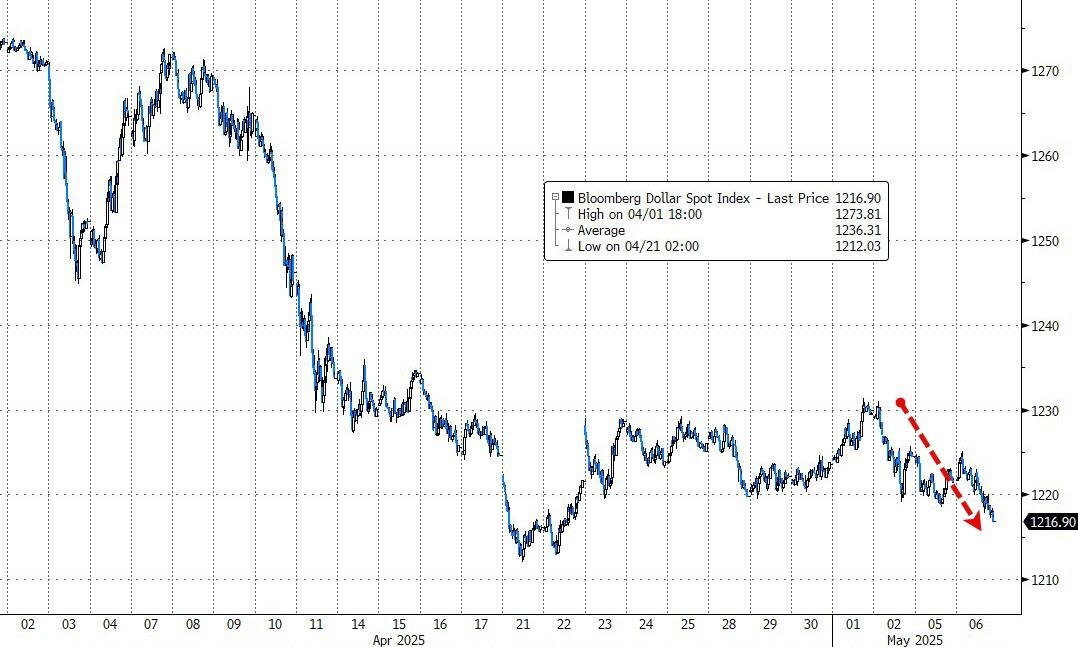
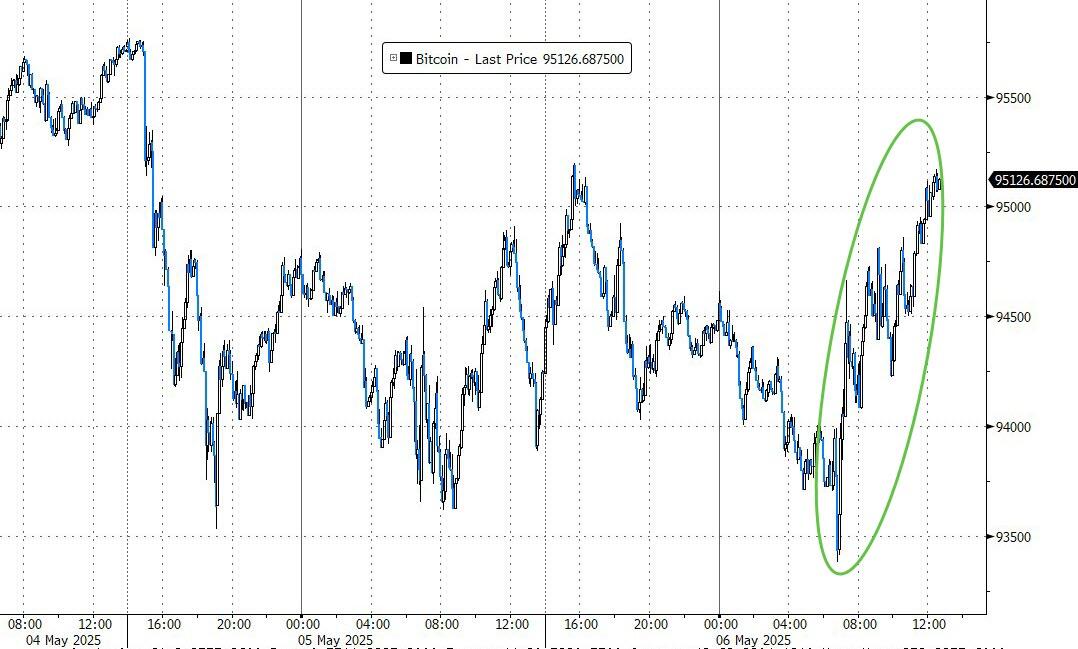
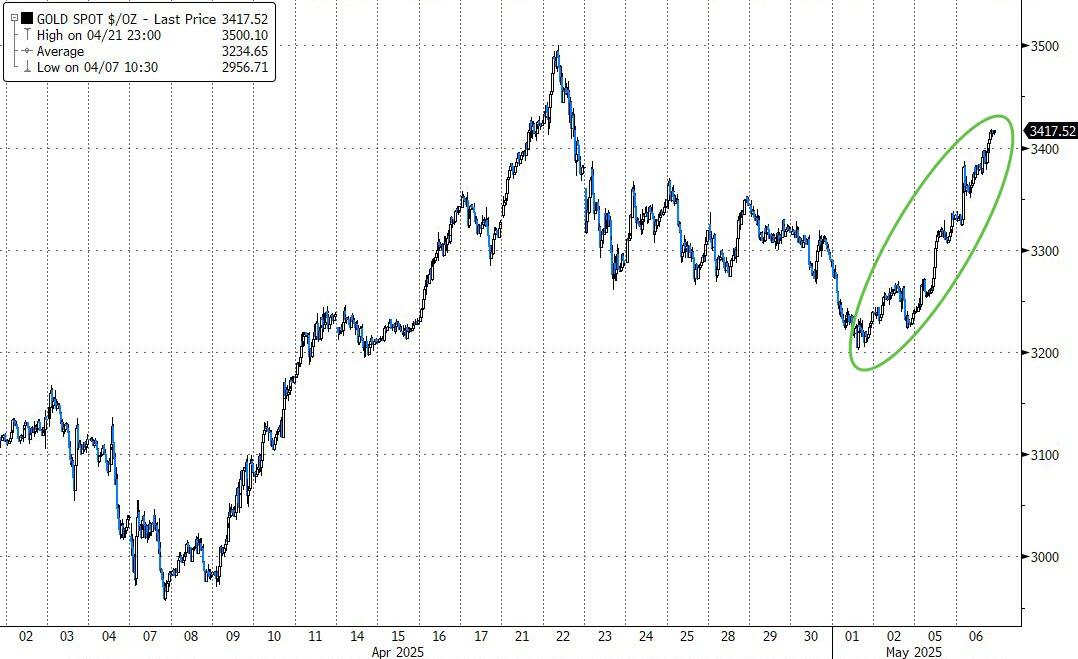
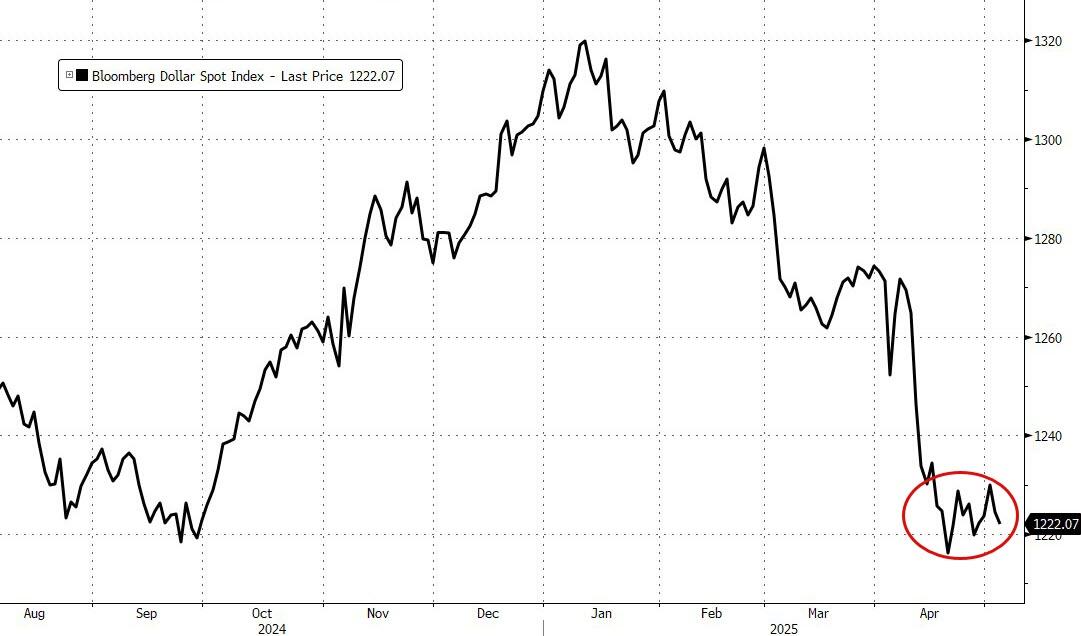
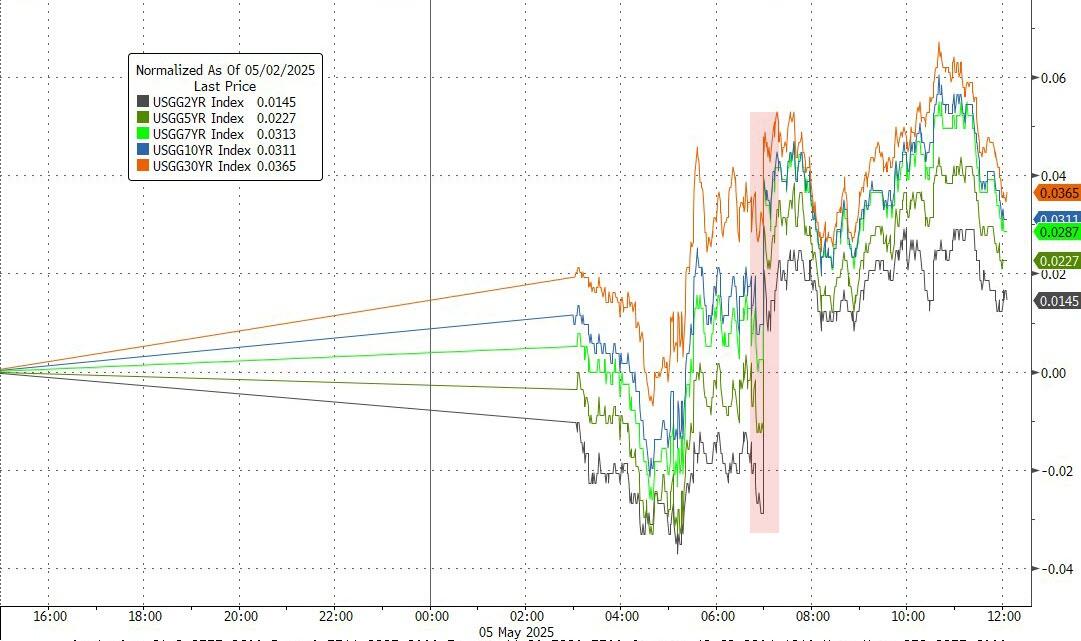
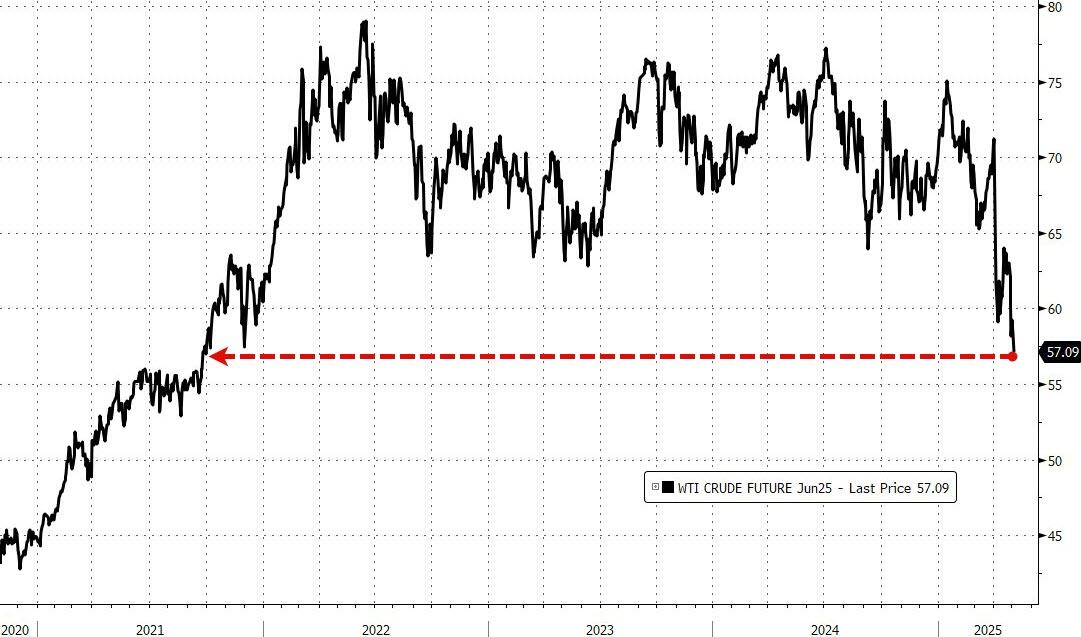
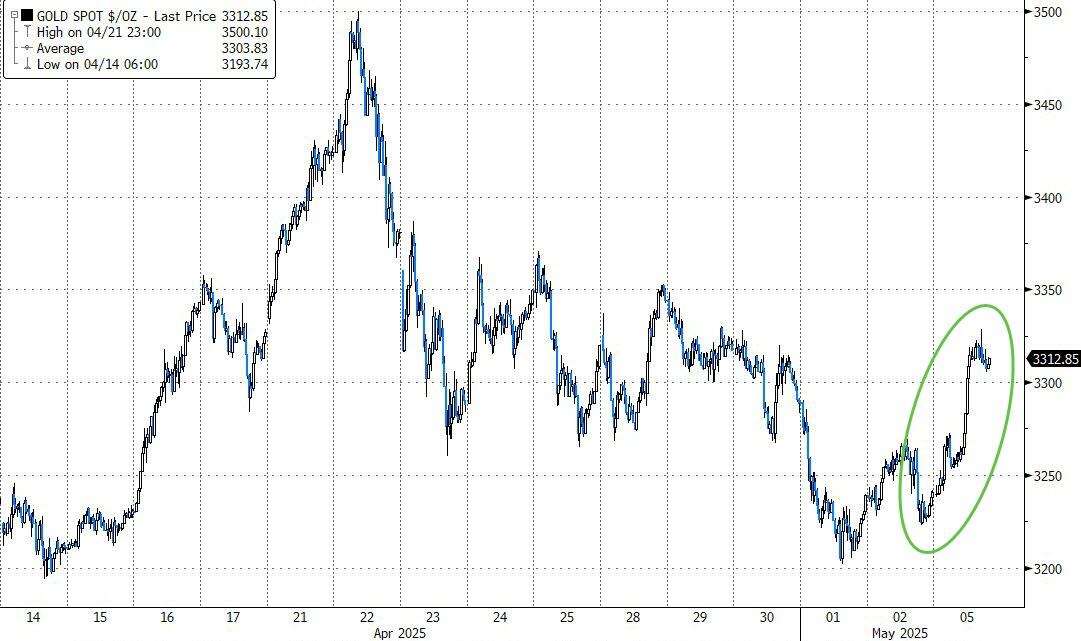
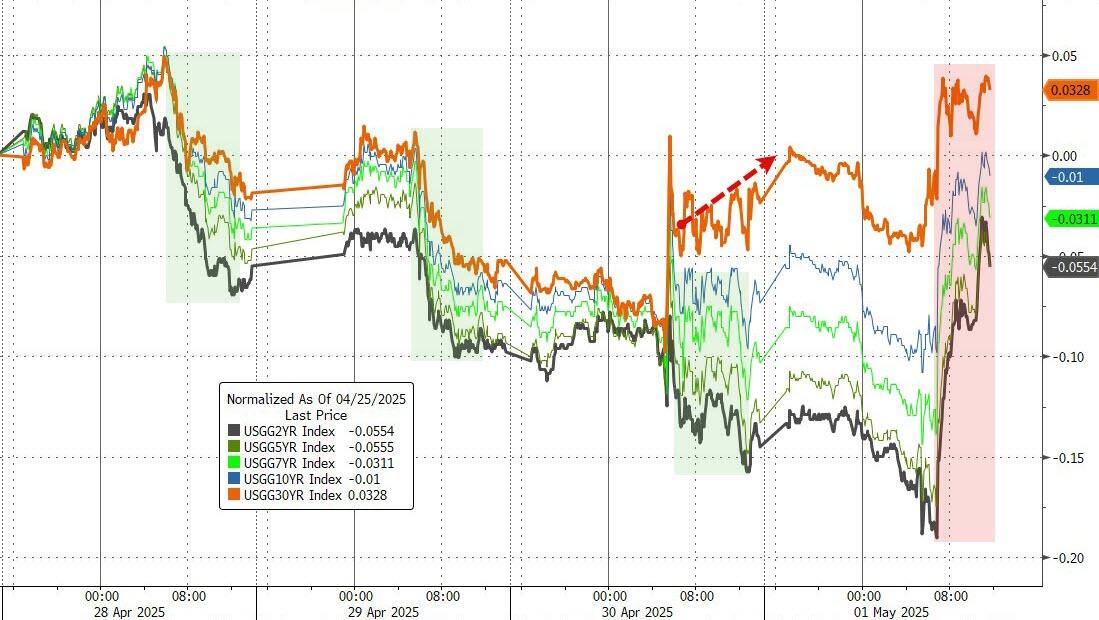
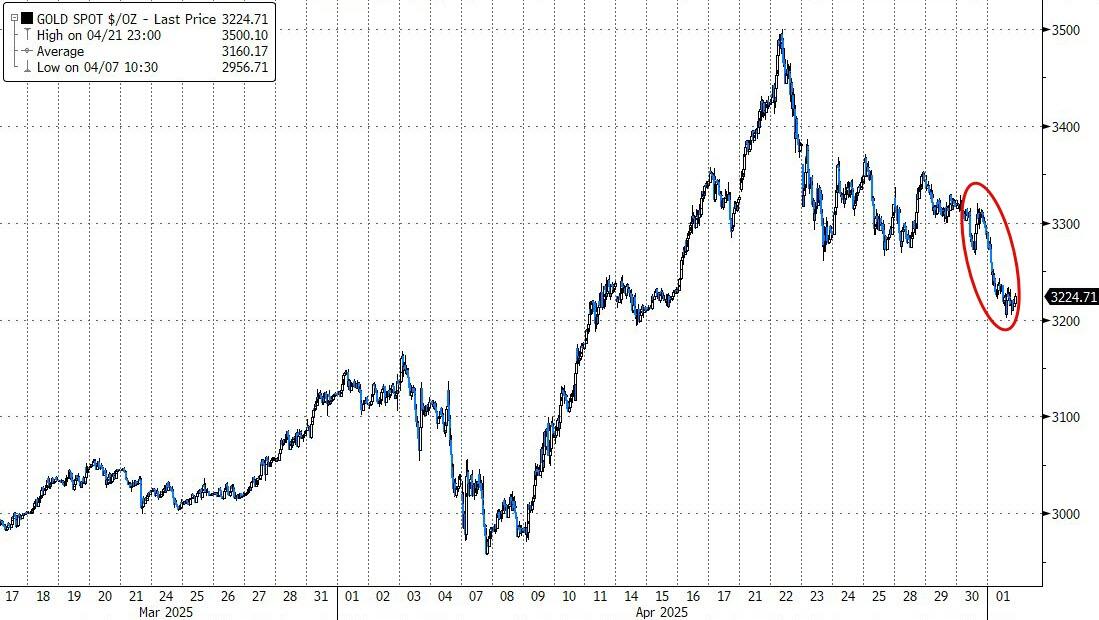
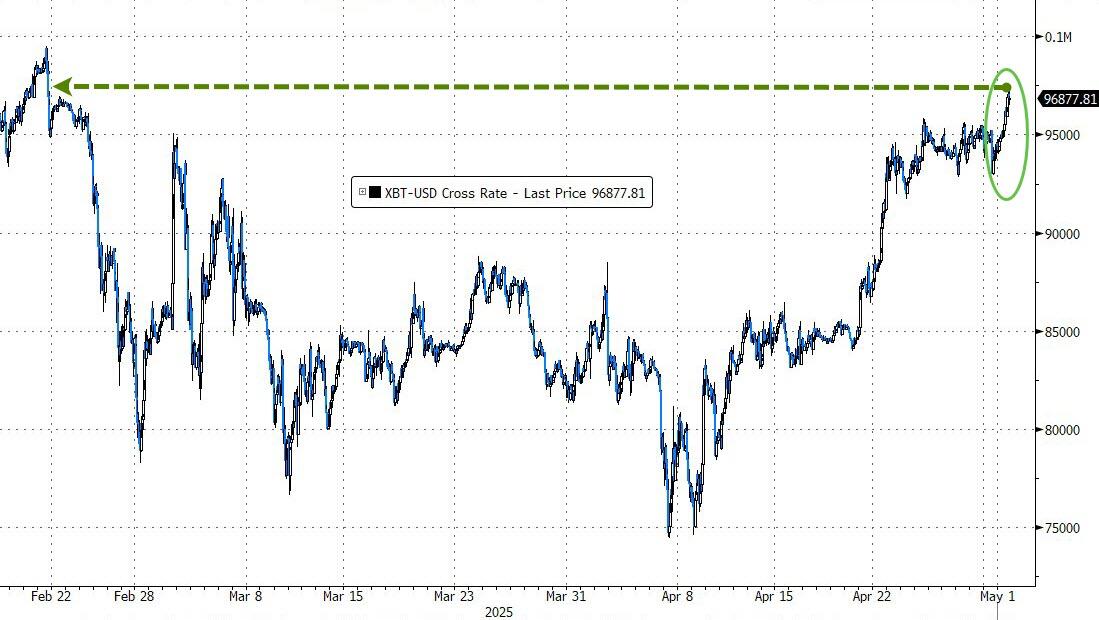
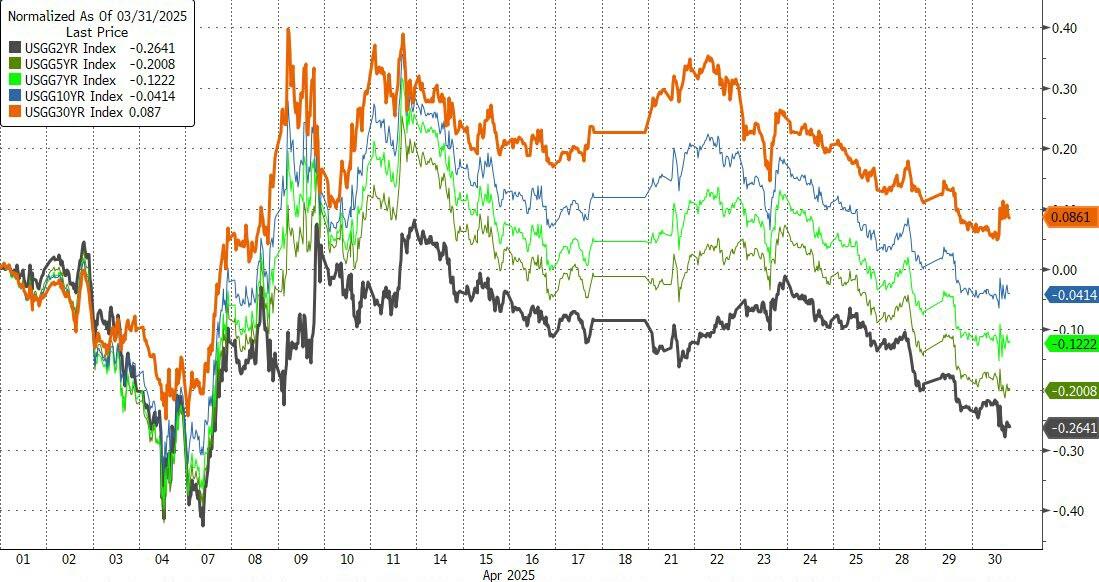
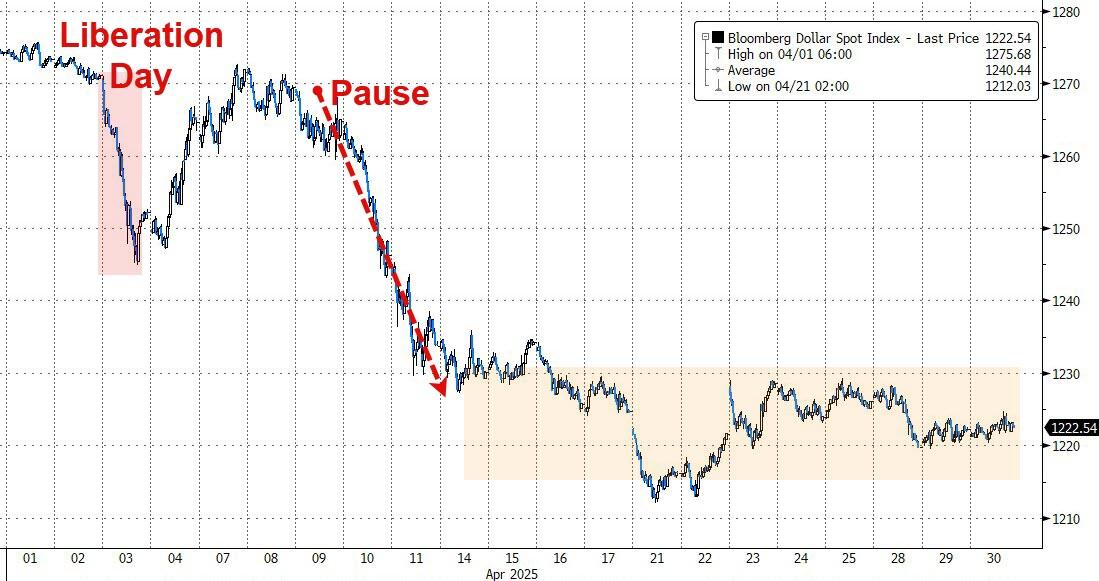
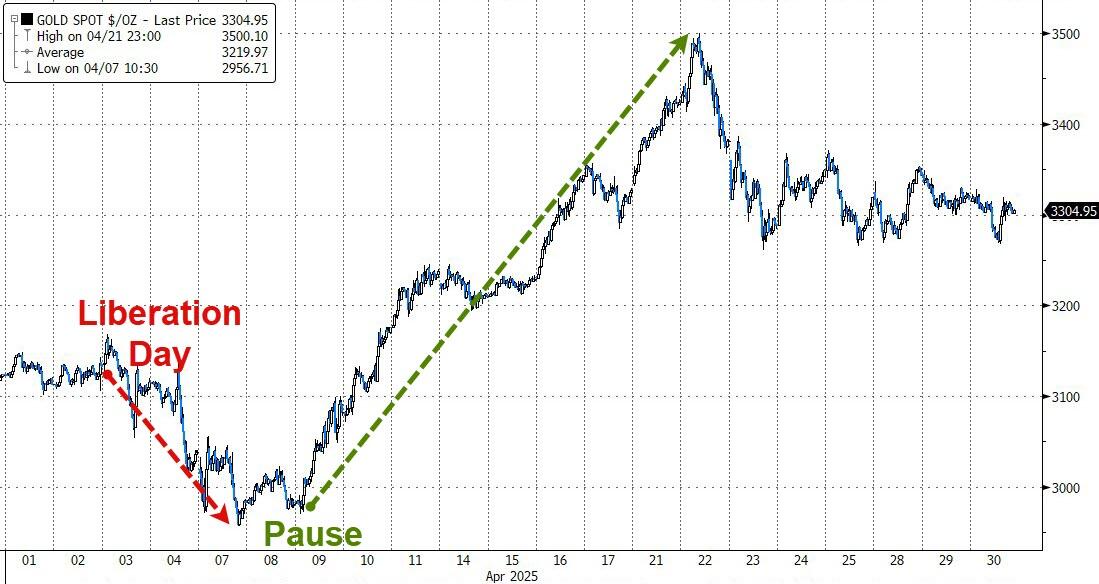
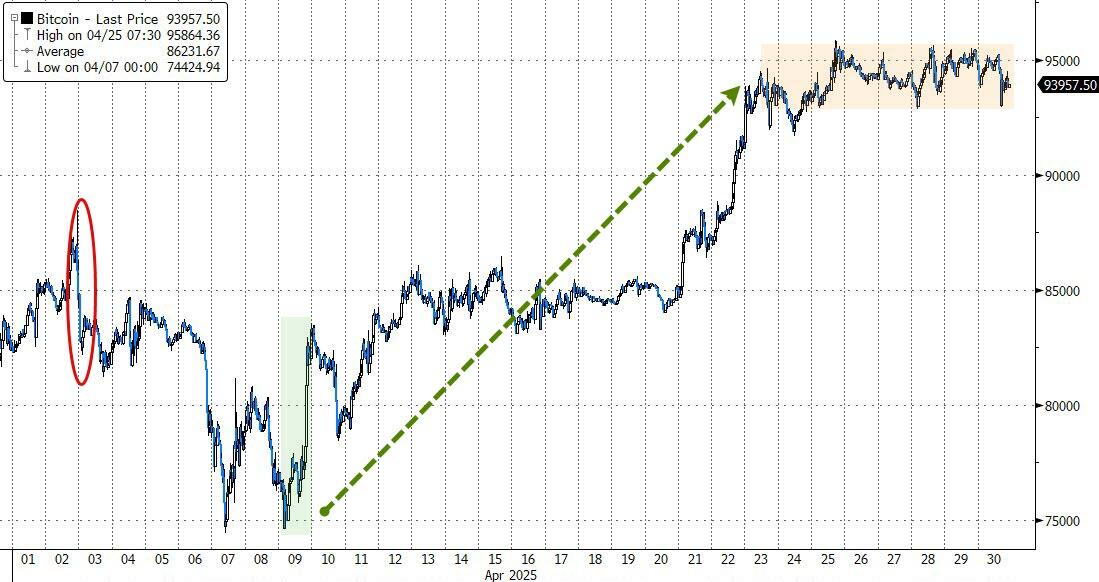
Bond yields pulled back, Bitcoin jumped but retreated from its intraday highs, gold remained stagnant, the dollar showed signs of life, and crude oil slipped again.
With the Fed decision out of the way, headline-driven market volatility will likely continue tomorrow.
Read More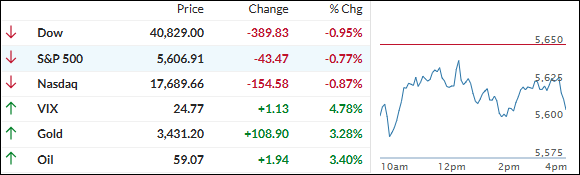