Gold Glows Amid Market Uncertainty; Bitcoin Recovers

Ulli Market Commentary Contact

[Chart courtesy of MarketWatch.com]

  1. Moving the market

Equities started the day on a downward trend as traders eagerly awaited the Fed’s policy decision tomorrow.

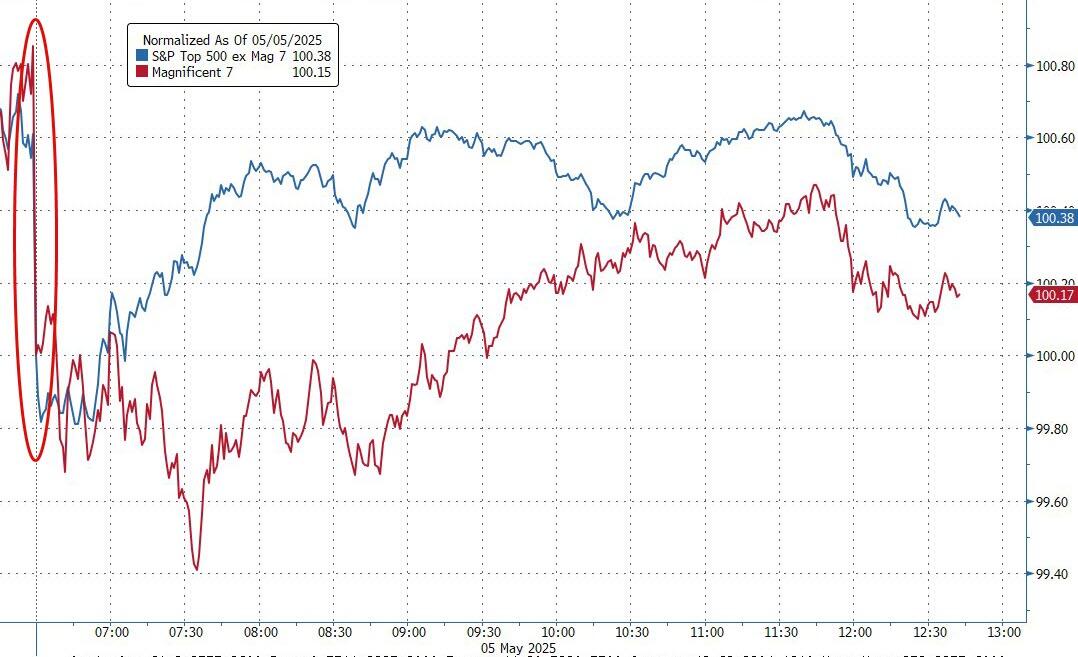
They were also tracking global news for any signs of progress on potential trade deals. Tech giants Nvidia and Meta, along with Tesla, saw declines. Tesla’s new car sales in Britain and Germany fell to their lowest levels in over two years, despite increasing demand for electric vehicles.

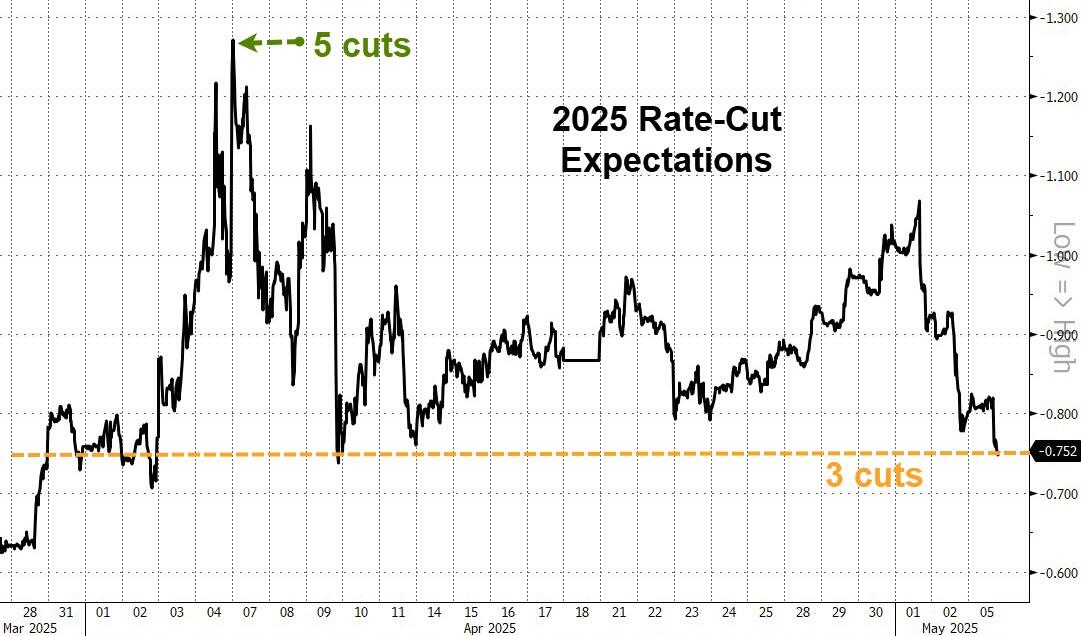
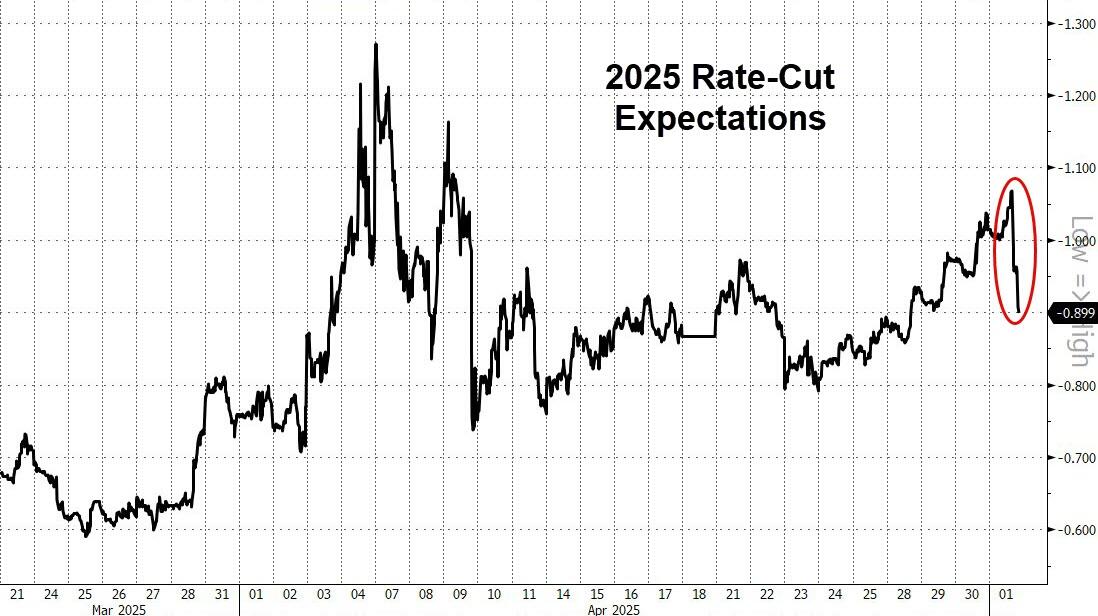
The Fed began its two-day meeting today, with a decision expected tomorrow. Anxiety remains high on Wall Street, even though a rate cut is not anticipated. The focus will be on Powell’s comments regarding the current state of the economy and his outlook.

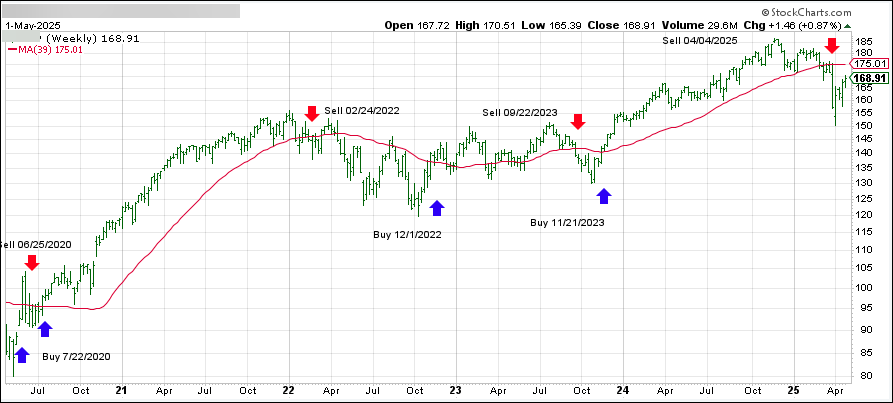
The S&P 500, along with the broader market, faces a significant challenge at its 200-day moving average (200DMA), which has been providing strong overhead resistance. If the attempt to break through this level is unsuccessful, we may see a reversal towards the lows made in April.

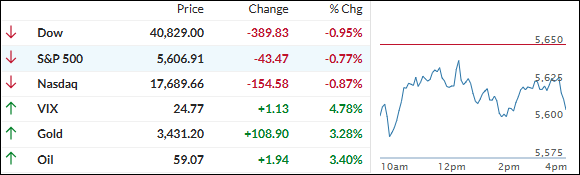
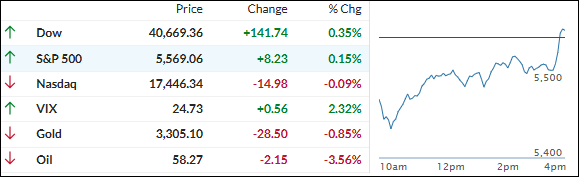
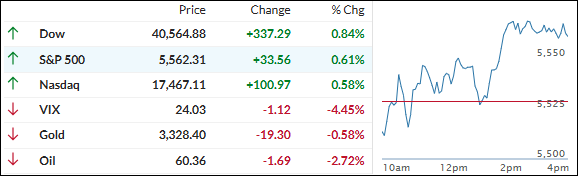
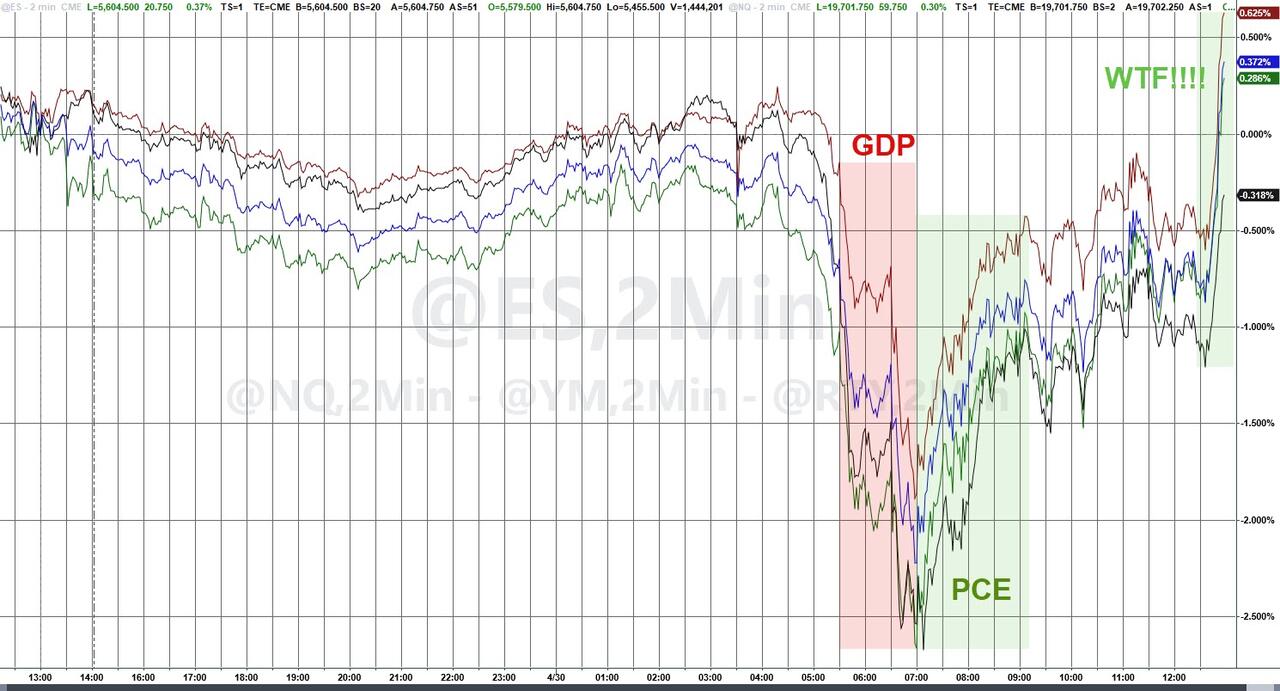
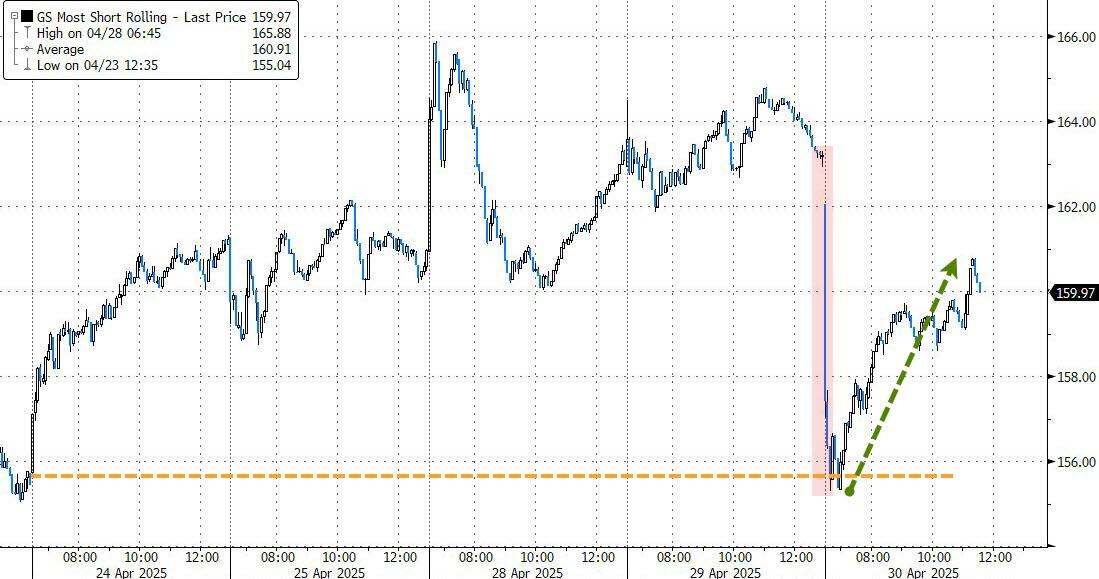
With low trading volume across the board, all attempts to rally above the unchanged lines failed, and the major indexes ended the session in the red.

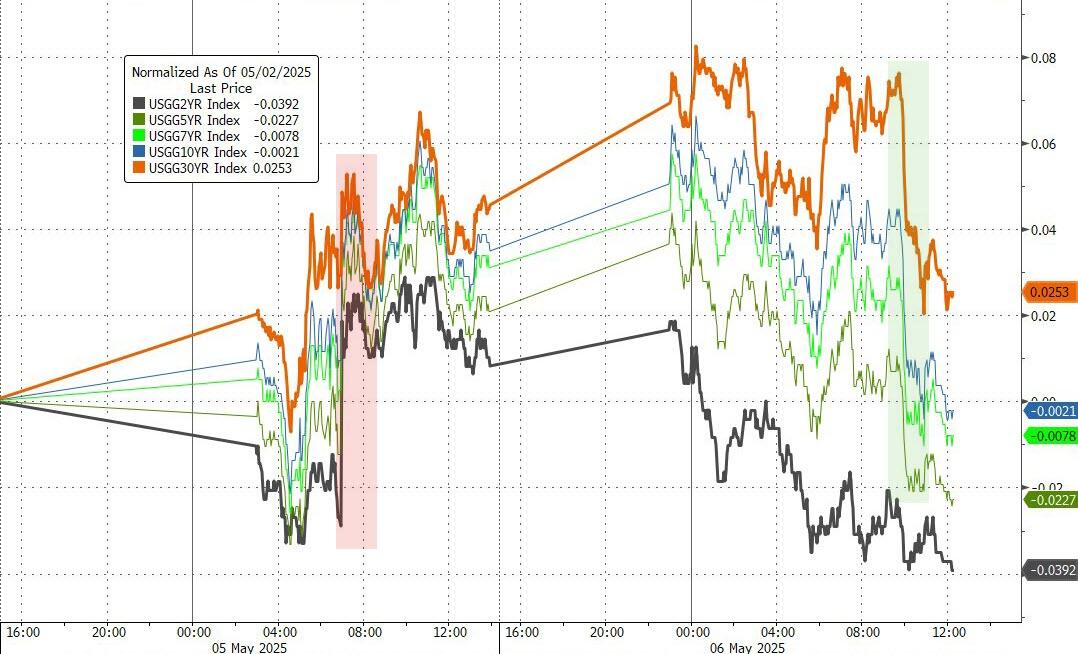
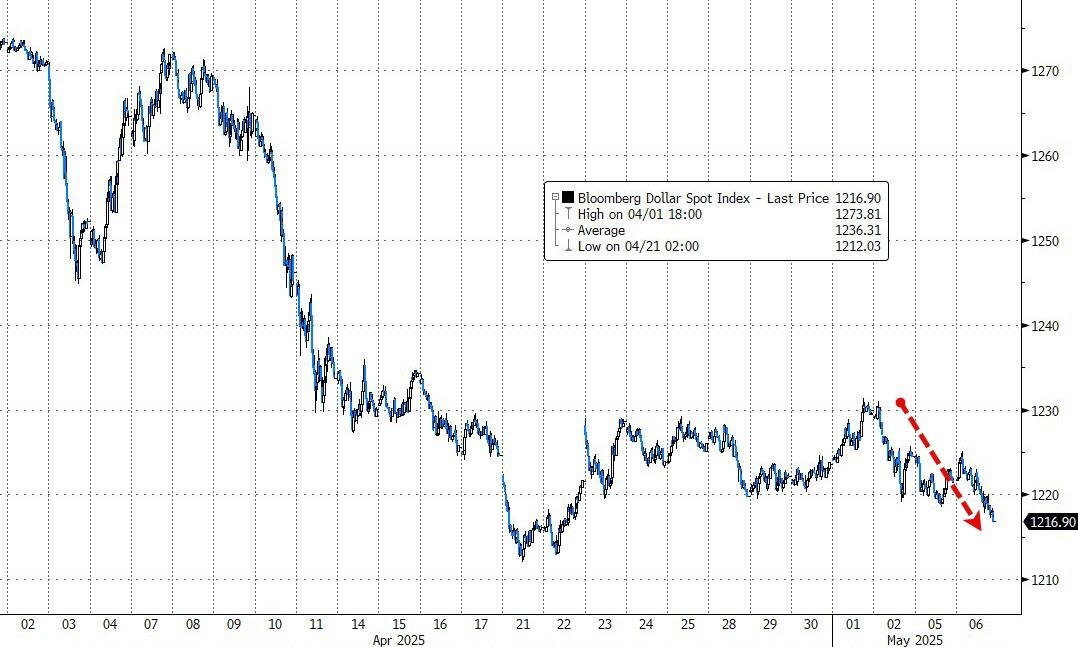
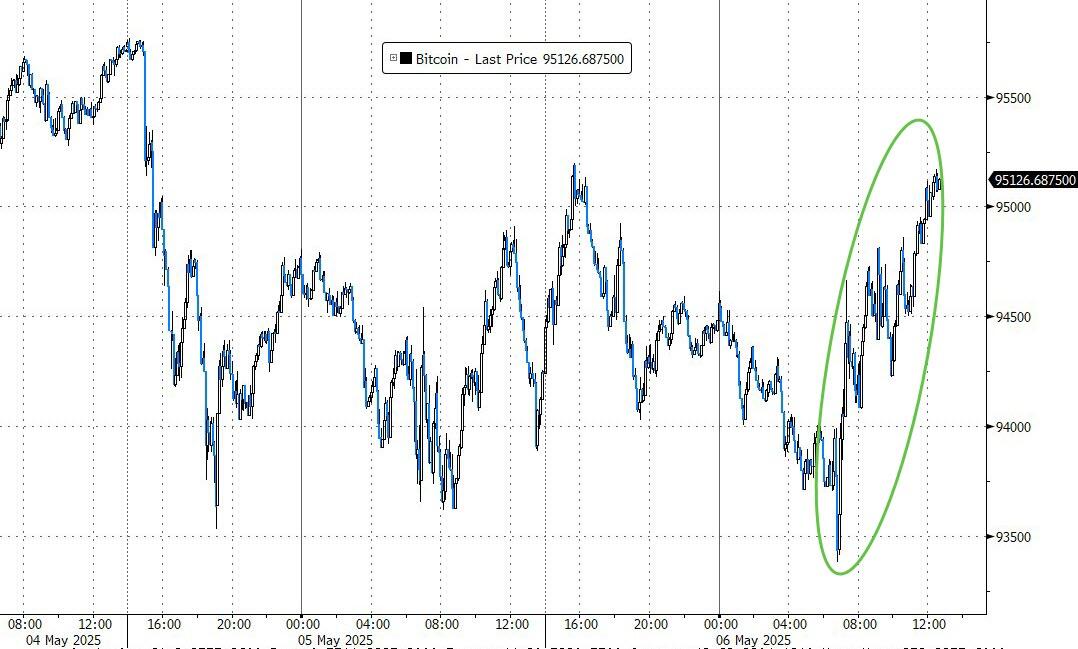
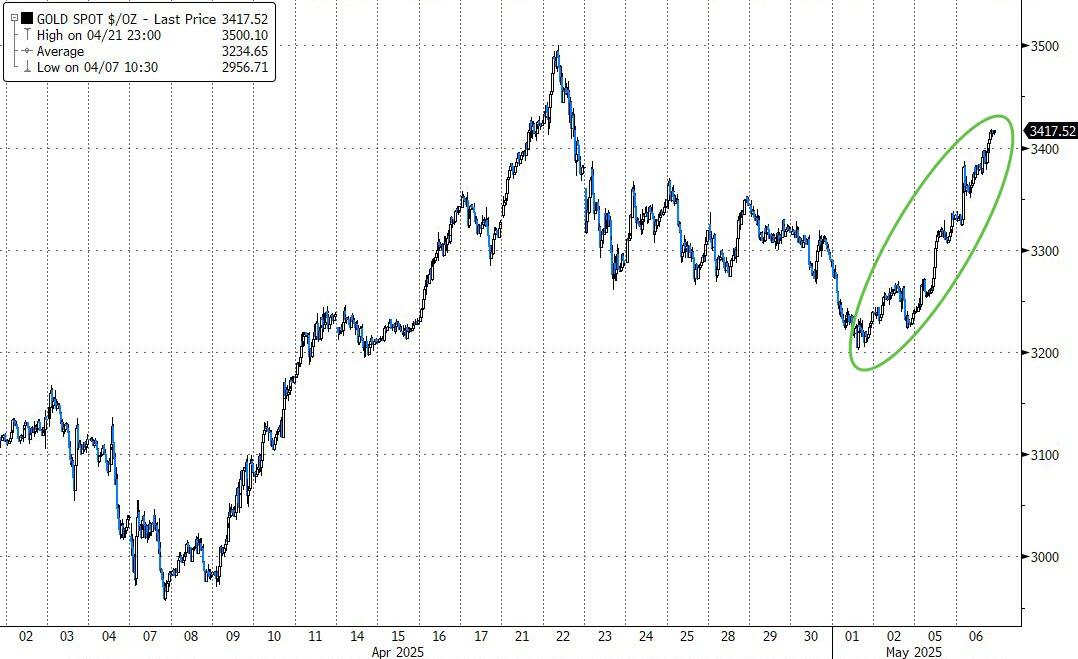
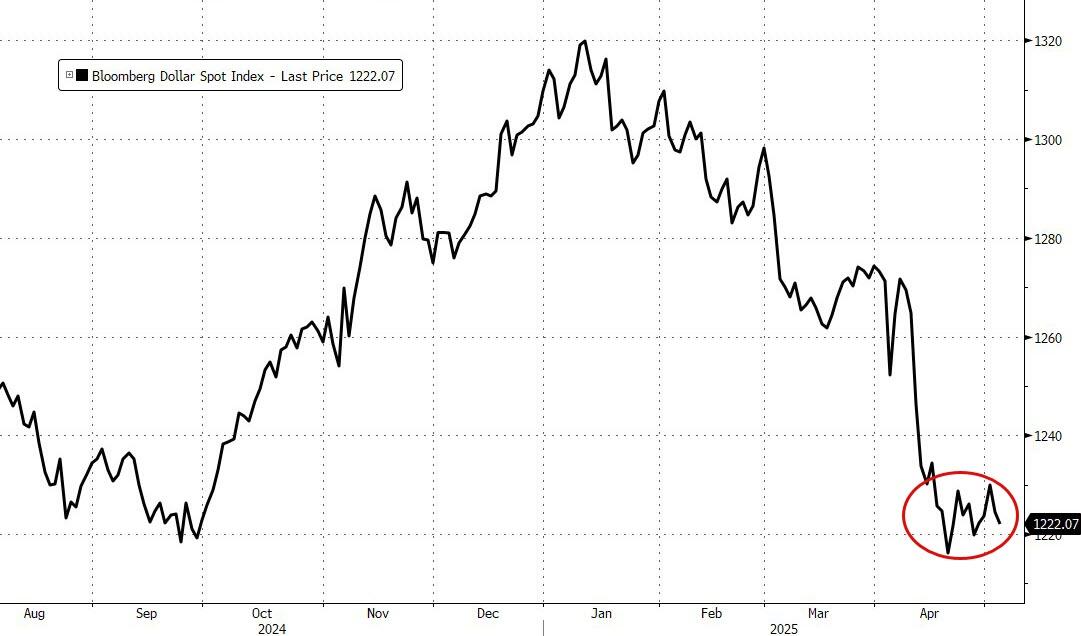
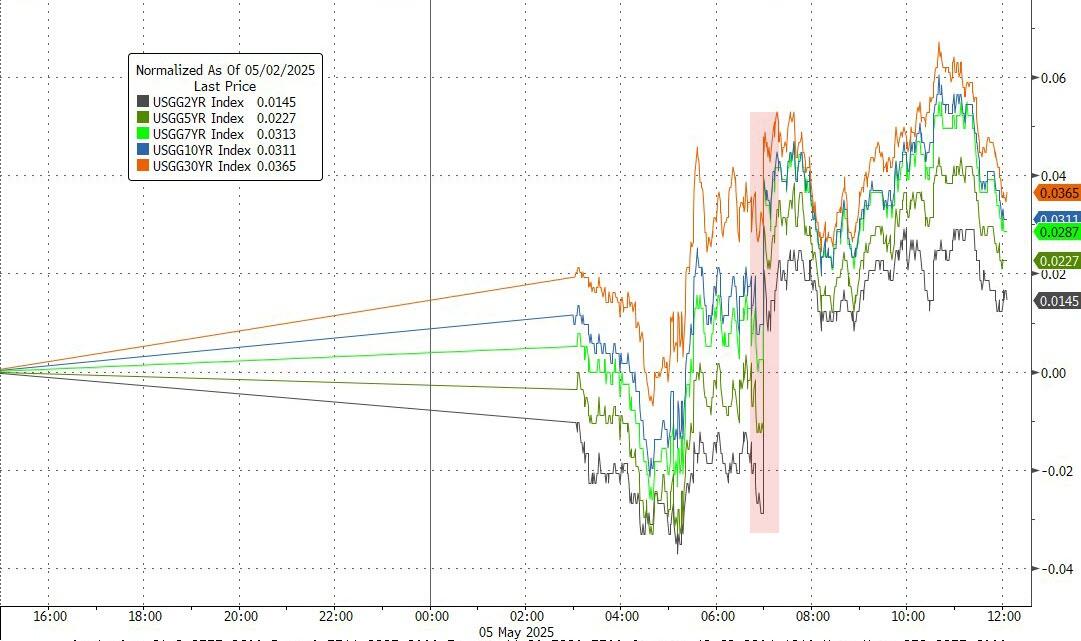
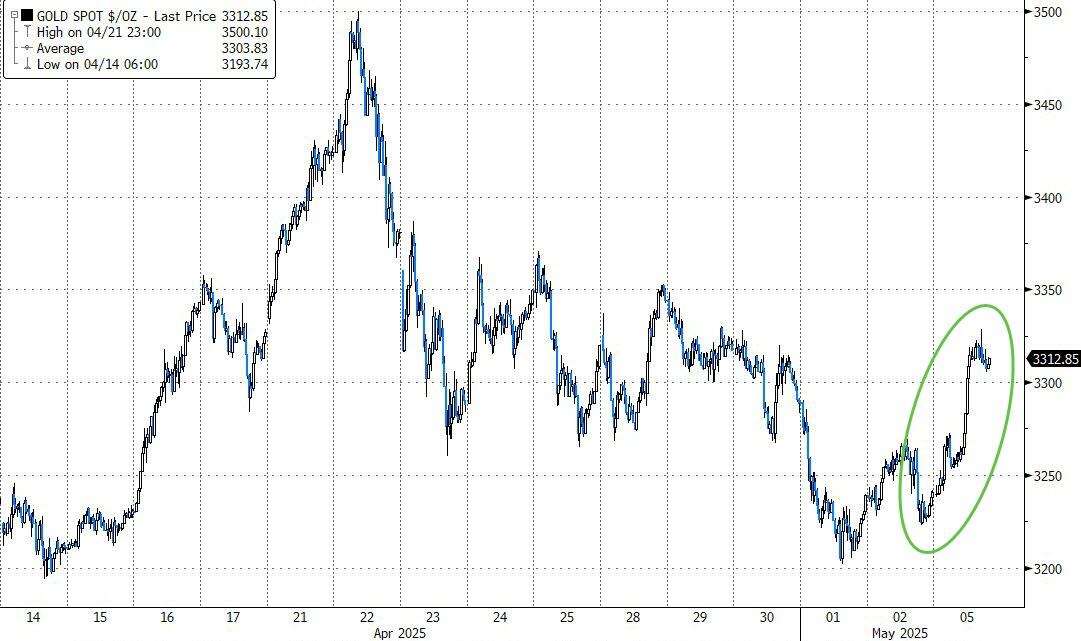
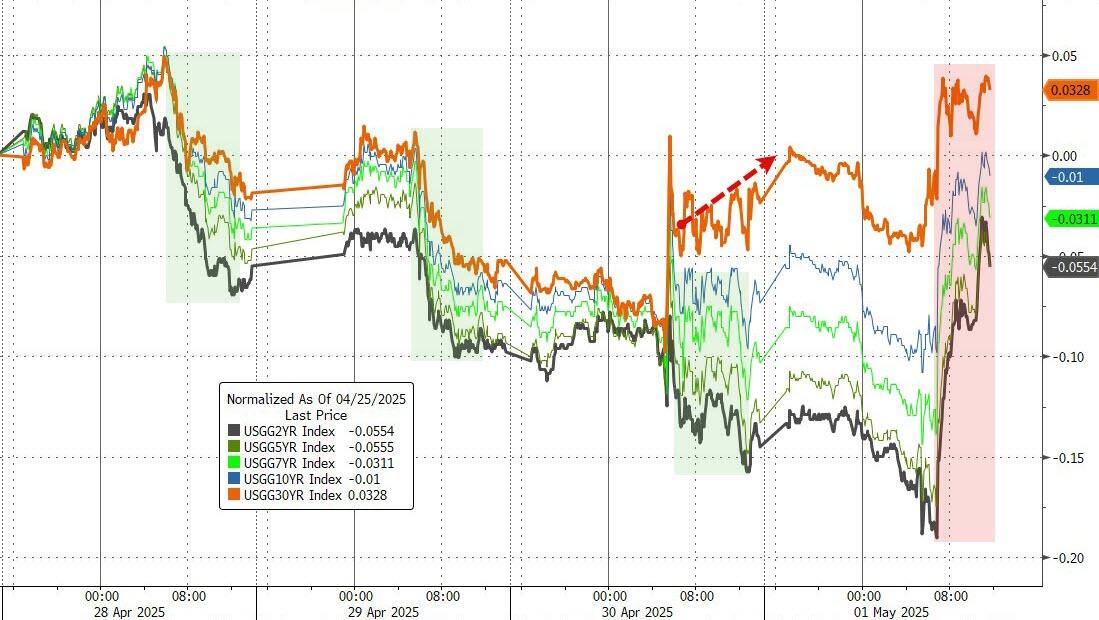
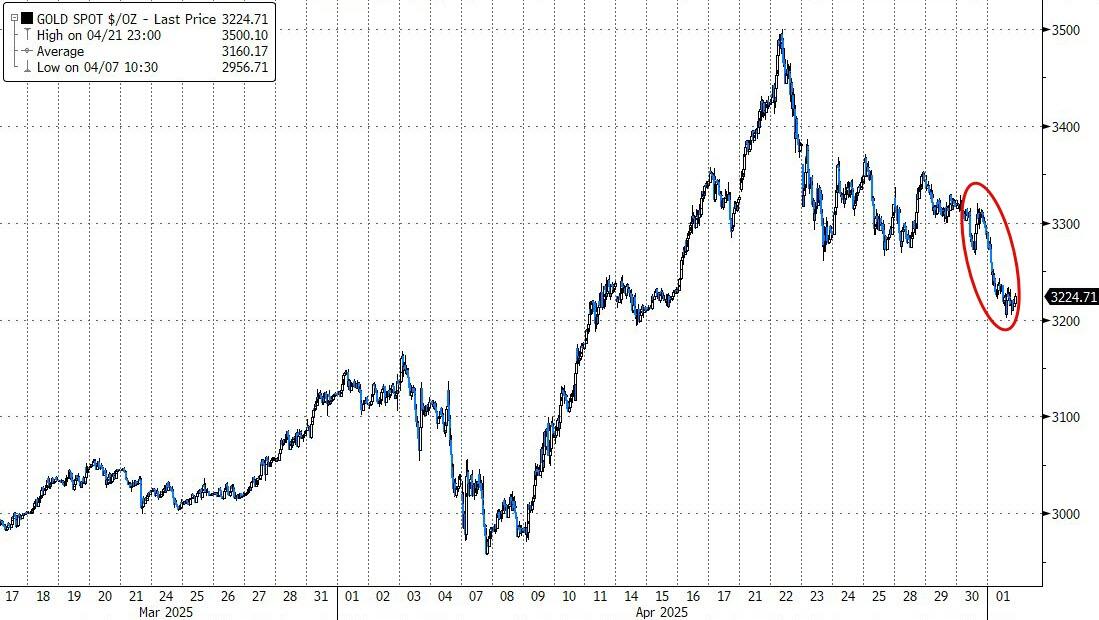
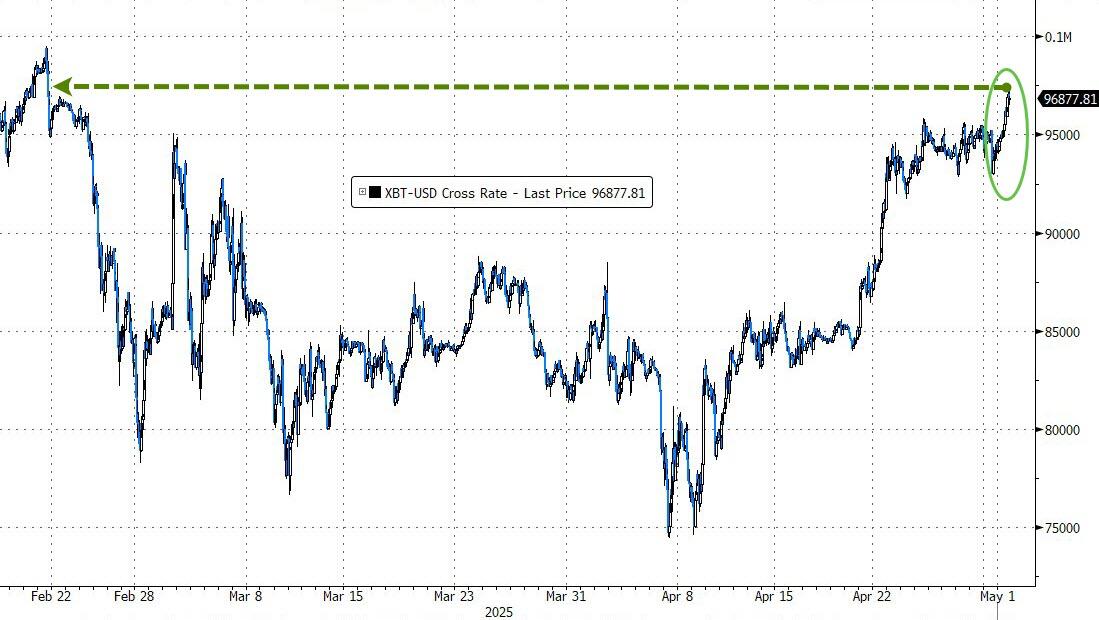
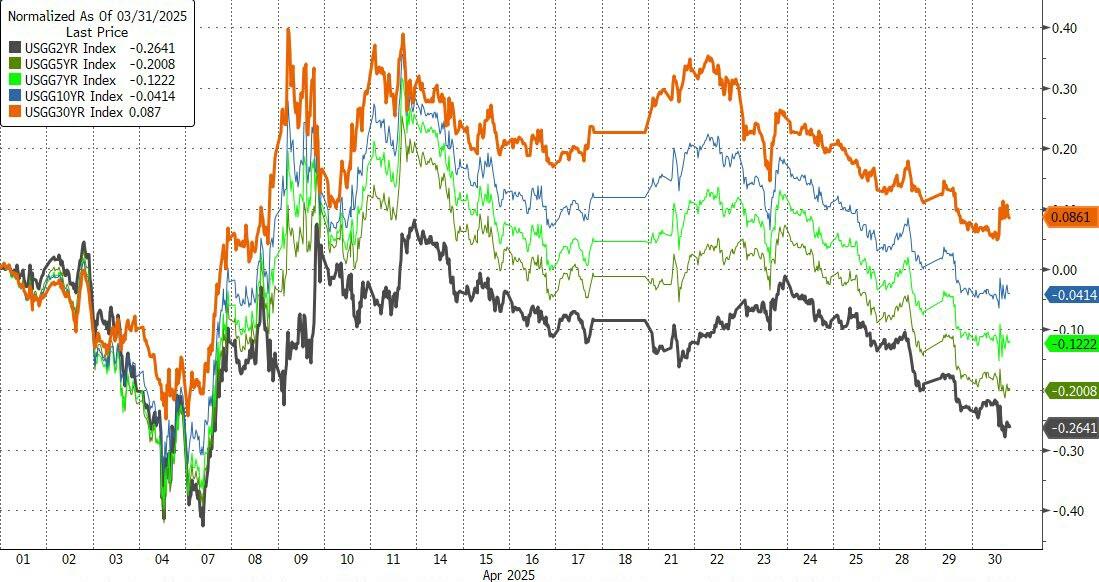
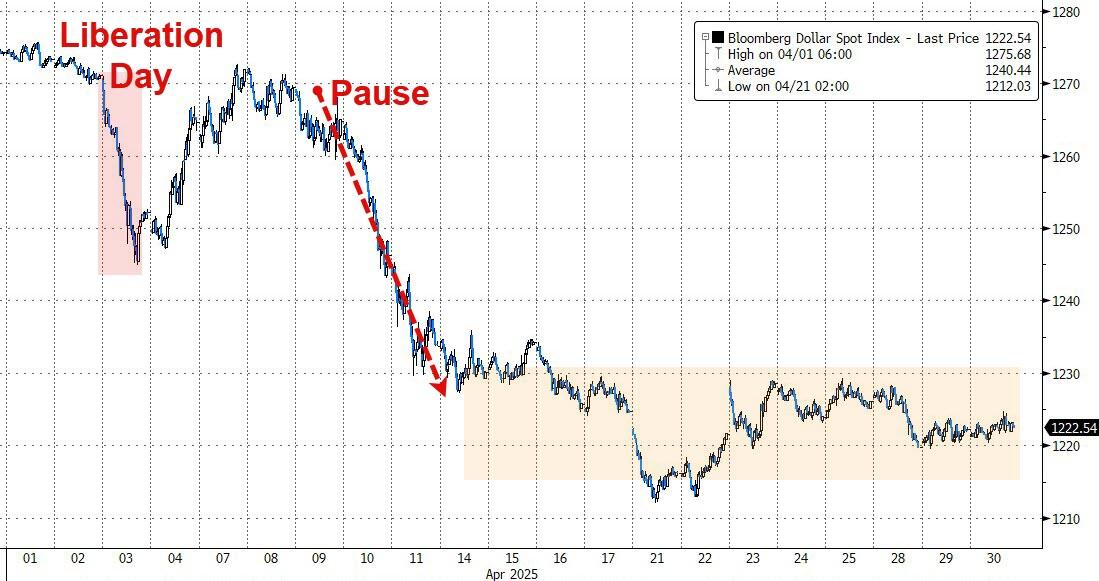
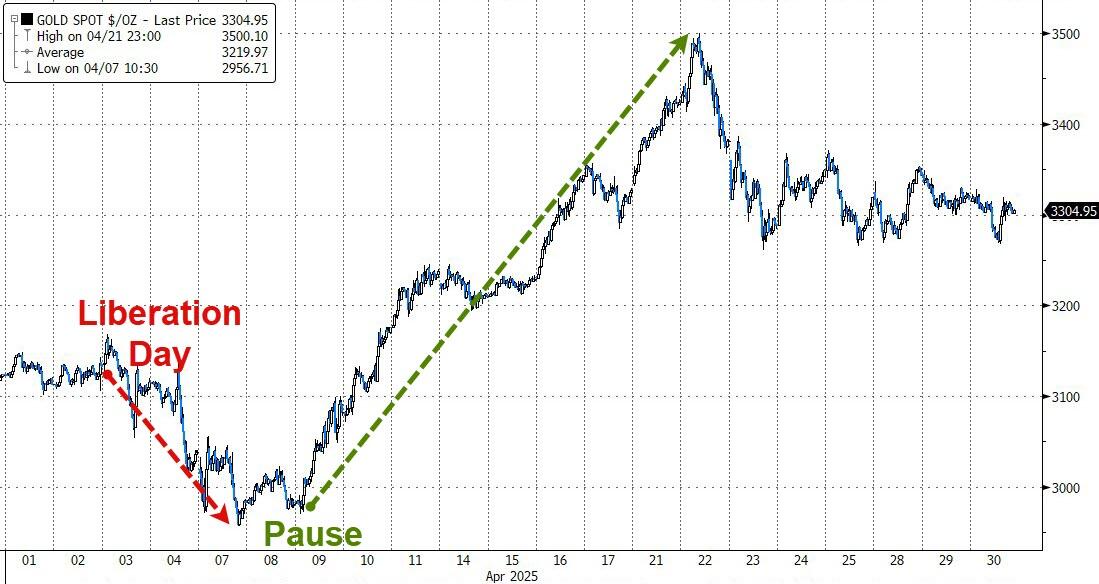
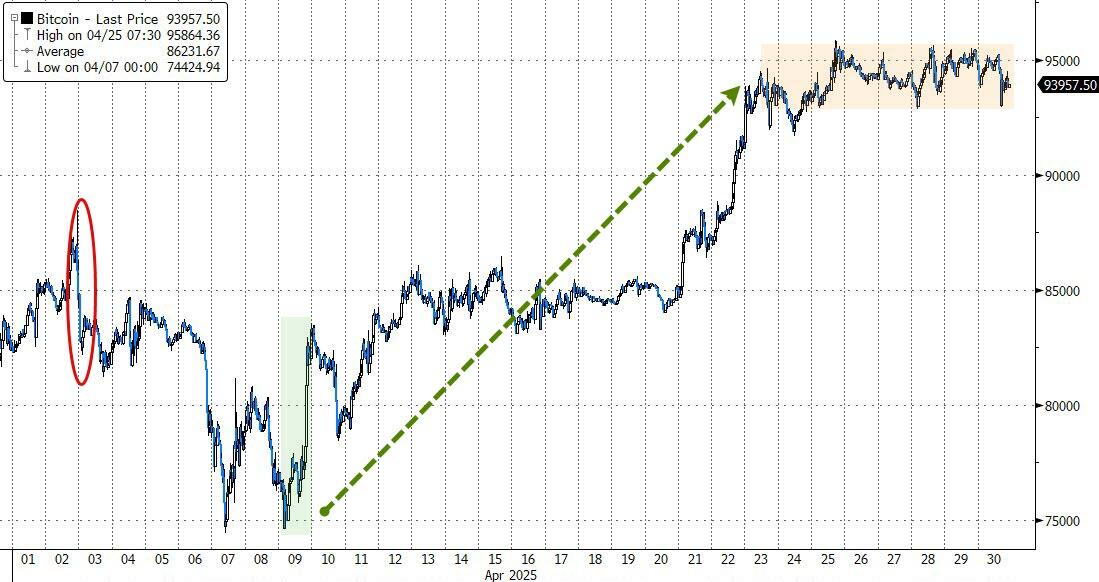
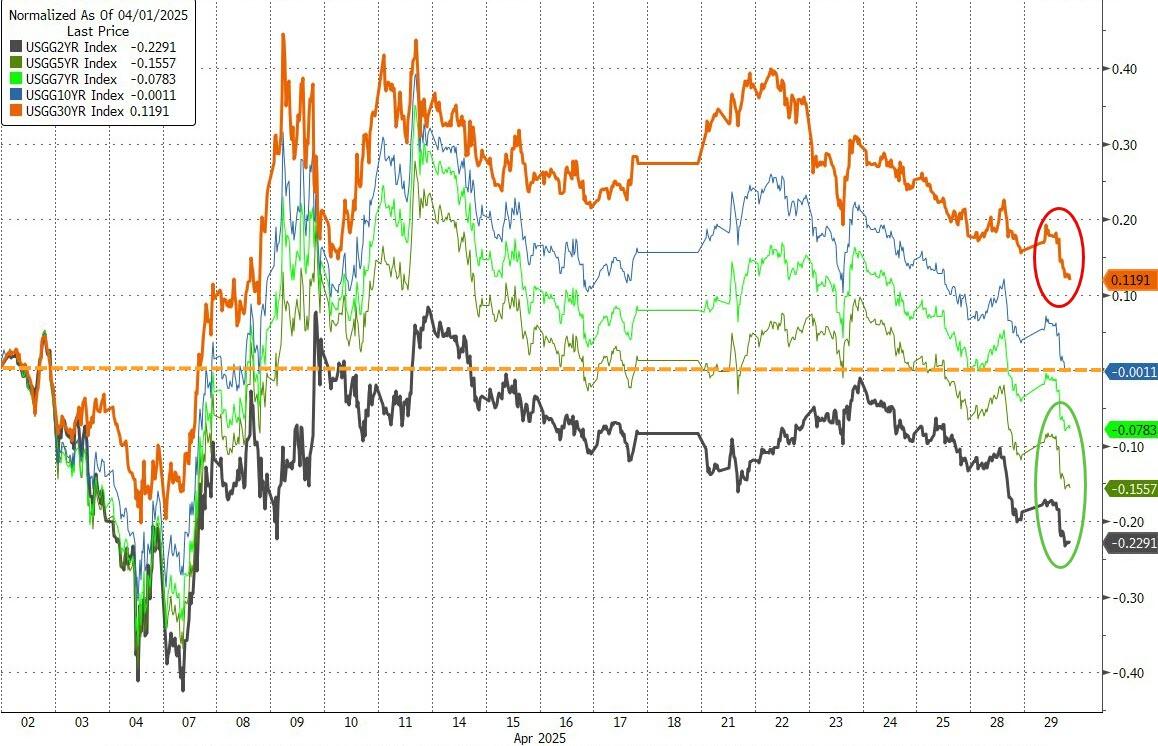
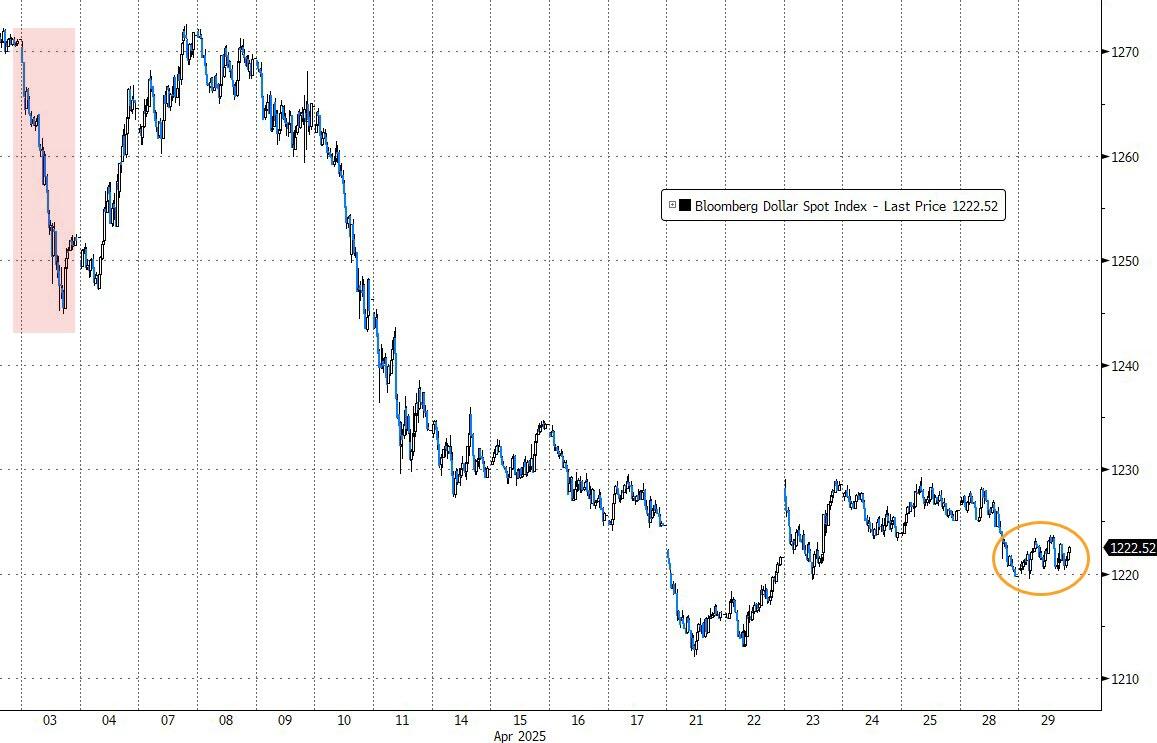
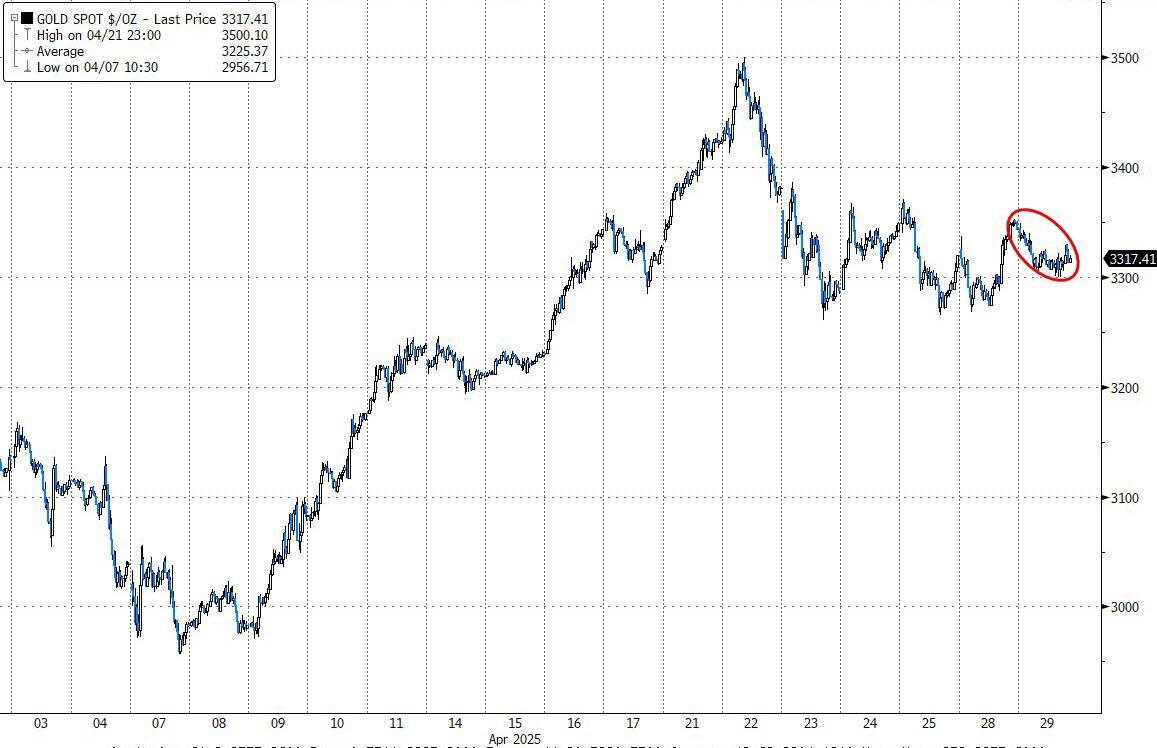
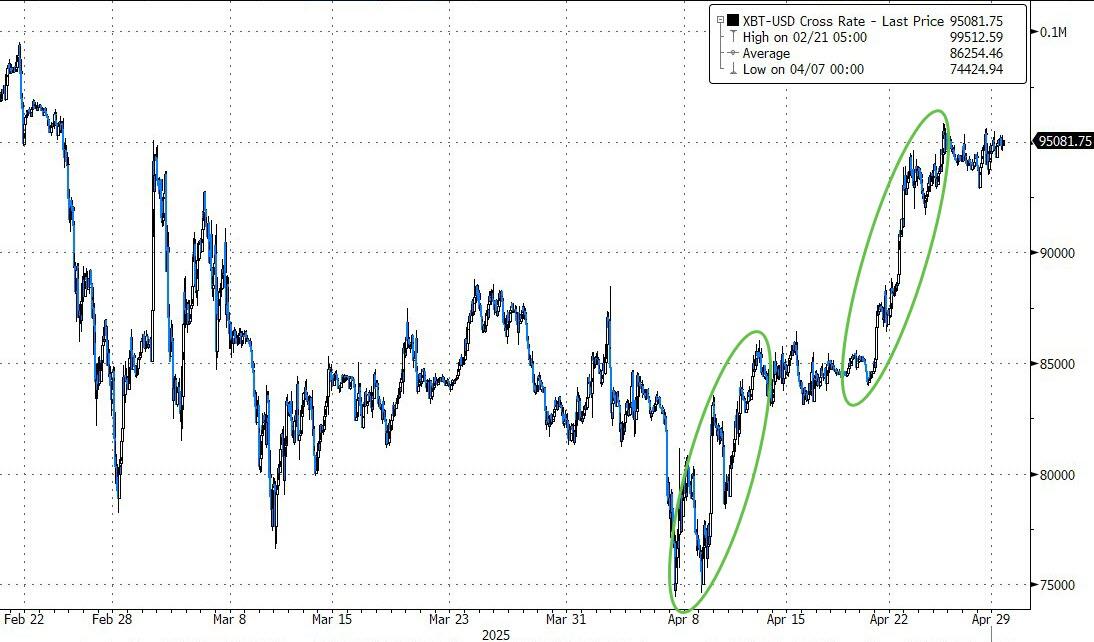
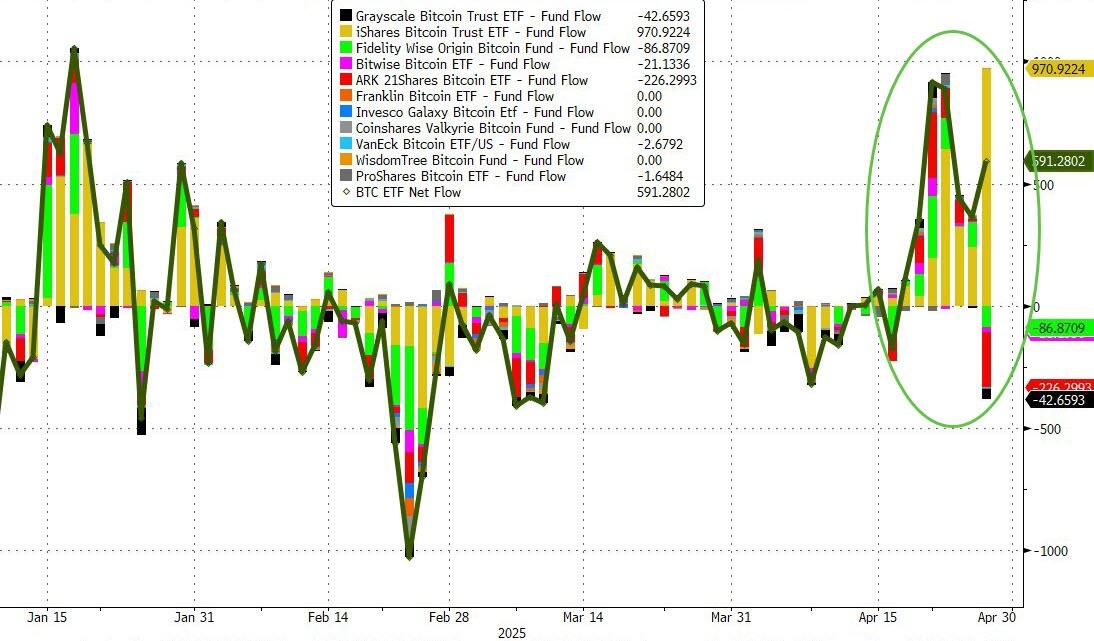
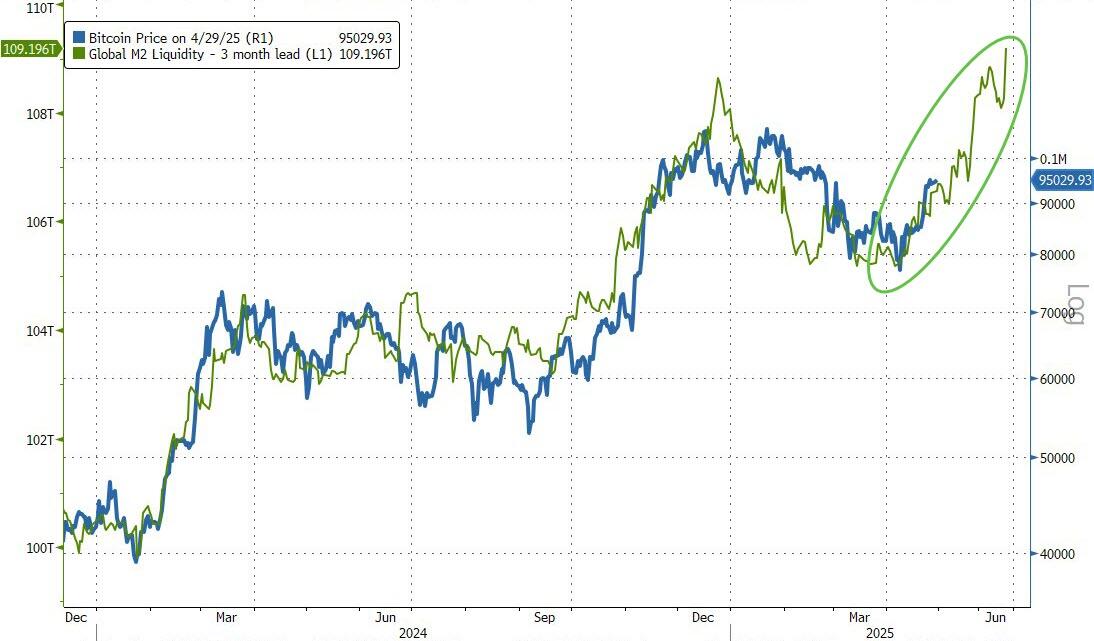
Bond yields slipped, the dollar continued its decline, and Bitcoin recovered from an early drop to climb back above $95,000. Gold had another impressive performance, gaining over 3% and reclaiming its $3,400 level.

The markets are at a crossroads and could break either way. As ZH pointed out, price action is mainly driven by short-term headlines and speculation on the evolving US tariffs story.

Read More

Gold Shines Amid Market Selloff And Mixed Economic Data

Ulli Market Commentary Contact

[Chart courtesy of MarketWatch.com]

  1. Moving the market

The markets pulled back early in the session as hopes for new trade deals diminished following President Trump’s announcement of surprise levies on movies made outside the U.S.

He elaborated on negotiations with various countries, emphasizing that he is setting the terms of any agreement. Additionally, he made it clear that there are no plans to talk to China, which affected traders’ expectations of progress.

This week, the Fed’s two-day policy meeting begins tomorrow, with a rate decision expected on Wednesday. Futures indicate only a 3.2% chance of a rate cut, but traders will be closely analyzing any commentary from Fed Chair Powell.

Despite efforts by traders and algorithms to maintain a nine-day winning streak, the market closed in the red due to a last-hour selloff. Mixed economic data lowered rate-cut expectations, and the dollar continued to weaken.

Mega-tech stocks and the Mag7 basket managed to recover from early losses but still ended the day in the red. Bond yields rose moderately, oil prices plunged, and Bitcoin retreated.

The standout performer of the day was gold, which rallied 3% and nearly reached the $3,350 level.

Does this indicate that its recent correction is over?

Read More

Weekly StatSheet For The ETF Tracker Newsletter – Updated Through 05/01/2025

Ulli ETF StatSheet Contact

ETF Data updated through Thursday, May 1, 2025

How to use this StatSheet:

  1. Out of the 1,800+ ETFs out there, I only pick the ones that trade over $5 million per day (HV ETFs), so you don’t get stuck with a lemon that nobody wants to buy or sell.
  1. Trend Tracking Indexes (TTIs)

These are the main indicators that tell you when to buy or sell Domestic and International ETFs (section 1 and 2). They do that by comparing their position to their long-term M/A (Moving Average). If they cross above, and stay there, it’s a green light to buy. If they fall below, and keep going, it’s a red light to sell. And to make sure you don’t lose your shirt if things go south, I also use a 12% trailing stop loss on all positions in these categories.

  1. All other investment areas don’t have a TTI and should be traded based on the position of each ETF relative to its own trend line (%M/A). That’s why I call them “Selective Buy.” In other words, if an ETF goes above its own trend line, you can buy it. But don’t forget to use a trailing sell stop of 12%, or less if you’re feeling nervous.

If some of these words sound like Greek to you, please check out the Glossary of Terms and new subscriber information in section 9.

  1. DOMESTIC EQUITY ETFs: SELL— effective 4/4/2025

Click on chart to enlarge

This is our main compass, the Domestic Trend Tracking Index (TTI-green line in the above chart). It has broken below its long-term trend line (red) by -3.42% and has moved into “Sell” mode as of 4/4/2025.

Read More

Bitcoin Surges To $97k As Equities Rebound

Ulli Uncategorized Contact

[Chart courtesy of MarketWatch.com]

  1. Moving the market

The tech sector led this morning’s positive opening, driven by strong quarterly results from Microsoft and Meta.

Both companies exceeded expectations, easing fears that the tariff war and a downturn in the U.S. economy might threaten the AI trade. It appears AI is less impacted than traders initially believed.

Adding to the bullish sentiment was Microsoft’s optimistic guidance, which further alleviated concerns about tech companies’ performance in the coming months. Microsoft’s shares rose by 7.6%, Meta’s by 4.2%, and Nvidia’s by 2.5% in sympathy.

Despite a negative reading of weekly jobless claims jumping to 241,000 versus an estimated 225,000, bullish sentiment remained strong. This is despite increased concerns about the economy following the recent negative first-quarter GDP report.

The major indexes started May with moderate gains, even though macro data declined. Bond yields surged, pushing the dollar higher and gold lower, while rate-cut expectations decreased. Bitcoin continued its ascent, reaching $97k today, its highest level since February.

Interestingly, equities have rebounded despite a weakening global economy, a negative GDP reading, and falling oil prices, which put the U.S. at risk of sliding into a recession. This points to shrinking earnings in corporate America.

As ZH noted, even a mild 5% contraction in earnings from 2024 would leave the aggregate earnings per share of the S&P 500 basket at $225, roughly corresponding to a value of $3,874 on the index. The S&P 500 is almost 2,000 points higher than that level.

Will the markets continue to live in denial a little while longer?

On a personal note, I will be out tomorrow, so there will be no Friday post or Saturday Cutline report.

Read More

Gold And Bitcoin Shine Amid April’s Market Volatility

Ulli Market Commentary Contact

[Chart courtesy of MarketWatch.com]

  1. Moving the market

An early stumble interrupted April’s comeback rally as bad news about the U.S. economy pulled the markets down.

First-quarter GDP declined by 0.3%, a sharp reversal from the 2.4% increase in the fourth quarter. The Commerce Department report also showed a slowdown in consumer spending and a decline in government spending, the latter being a result of DOGE cuts.

A separate private payroll report from ADP signaled a slowdown in that sector, with private payrolls in April growing by only 62,000, well below the estimated 120,000. This dampened bullish sentiment, which had pulled the S&P 500 out of an 11% tailspin, leaving the index down only around 1% for the month.

In the end, the Dow, and the S&P 500 managed to crawl back out of their early hole to close slightly in the green, helped by a last-hour melt-up. It was a choppy end to a choppy month, described by ZH as a 16% peak-to-trough drawdown followed by an 18% rally in the last few weeks.

Growth and inflation data surprised to the downside, pushing the much-feared stagflation scenario to the back burner, at least for now. The most shorted stocks dumped after the opening but were squeezed higher as dip buyers stepped in.

With weak macro data, it came as no surprise that rate-cut expectations surged while bond yields slipped. The dollar dropped over 4% during April, its worst performance since November 2022.

Gold moved in the opposite direction, gaining almost 6%, marking its fourth straight monthly rise, while Bitcoin rallied 14% for the month, its best performance since November, according to ZH.

It seems we are back to “bad news is good news,” as far as stocks are concerned, with bonds, crude oil, dropping U.S. inflation, and copper pointing to a recession, while rate-cut expectations are jumping higher along with equities.

Read More

Bullish Sentiment Drives Market Rebound Despite Volatility

Ulli Market Commentary Contact

[Chart courtesy of MarketWatch.com]

  1. Moving the market

The major indexes opened flat and remained close to their initial levels in early trading, as Wall Street awaited updates on trade deal negotiations.

While the Treasury Secretary mentioned productive discussions with Japan and hinted at a potential “framework” agreement with India, the absence of details regarding China put pressure on the markets.

General Motors saw a decline despite reporting better-than-expected profits, as the automaker announced it was reassessing future guidance and suspending additional share buybacks due to uncertainties surrounding levies and rising global tensions.

Big Tech will be in the spotlight tomorrow and Thursday, with Meta, Microsoft, Apple, and Amazon set to report their quarterly results.

Of the more than 36% of S&P 500 companies that have reported so far this season, approximately 73% have exceeded expectations, according to FactSet. This is slightly below the 5-year average of 77%.

Despite market volatility, bullish sentiment emerged midday, leading to a rebound and another positive close for the major indexes. The theme of the day was “bad news is good news,” as weak macroeconomic data increased expectations for rate cuts.

Bond yields fell again, the dollar remained stable, but gold slipped while successfully defending its $3,300 level. Bitcoin edged higher, maintaining its $95k level, and continued to see significant inflows into its ETFs.

Have traders and investors recognized this chart, which seems to indicate that Bitcoin’s next major advance is imminent?

Read More