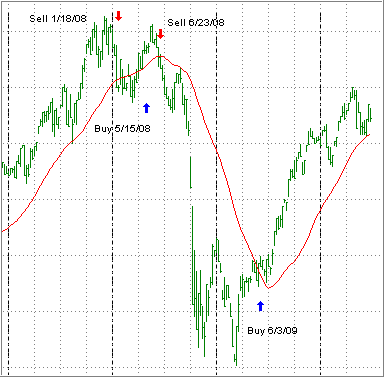
While June 23, 2010 passed quietly last week, it nevertheless marked the 2-year anniversary of our last domestic sell signal on 6/23/2008, which provided a safety net for those who followed its call and moved their portfolios out of the market onto the sidelines.
Here’s a look at the blown-up domestic Trend Tracking Index (TTI) chart covering the past two years:
[Double click on chart to enlarge]
I have on several occasions posted as to how avoiding a big drop relates to performance when compared to the S&P; 500, which stood at 1,318 on 6/23/08 and closed last Friday at 1,077.
Despite the enormous stimulus induced rally of 2009, the S&P; 500 still needs to gain another 22.40% just to reach the point we sold at in 2008. While that is possible, given the current economic backdrop, it’s highly unlikely at this time.
If you follow chart patterns, it becomes obvious that a huge double top was formed in 2008 leading to the subsequent crash. If you look closely, you’ll notice that we’re in the process of forming a double top again, although smaller in size.
Unless we break out to the upside by making a new high for the year, it’s more likely that a pullback will occur, which eventually will break the trend line (red) to the downside and move us back into bear market territory. As close as we’ve come recently, I would assume that this will happen within the next few weeks/months—that’s as close as I can guess.
Looking at this chart confirms again the importance of avoiding bear markets, while it is not necessary to participate in every upturn in order to outperform the S&P; 500. That’s an important point that I want to elaborate on since several readers have commented on it.
One widely held argument is that “if you’re out of the market, you will miss the big rebound rally.” Sure, you may miss some or all of it but the above chart speaks volumes. If you had just sat on the sidelines after 6/23/08, staying in money market, you would have missed 100% of the rebound totally and be still way ahead, as I pointed out above.
This supports my long-held view that it is more important to avoid bear market drops than participate in every rally.
Some readers have a misconception about trend tracking I want to clarify. They erroneously assume that during a bullish period, such as the last 10 months of 2009, trend tracking will outperform or at least match the gain of the S&P; 500. Expecting that is missing the point.
To be clear, during such bullish periods, you will lag performance more often than not. There are several reasons for that:
1. A buy signal may not be generated until a later point in time, thereby shortening the investable time span.
2. Depending on client risk tolerance, we may ease into the market with less than 100% of portfolio value.
3. We may use funds/ETFs with a lower beta than the S&P.;
4. We may experience a whip-saw signal, which will reduce returns.
Having pointed out these limitations, it’s important to look at the overriding benefit, which is not participating in major bearish periods. Since markets go down a lot faster than they go up, this should always be priority one.
Here’s the important point I am trying to make: Only when you combine bull AND bear markets will you have a chance to outperform the S&P.; Again, you very likely will not be able to do so during bullish periods alone, as pointed out above, unless you are extremely aggressive.
That means you have to keep the big picture in mind and not just focus on what happened during the past year, as the market rebounded, but be aware of the fact that only when you combine the good with the bad, you will come out ahead a winning investor.
Contact Ulli
