04-05-2012

Ulli Newsletter Archives Contact

The ETF/No Load Fund Tracker—Monthly Review—March 31, 2012

Markets Remain In Rally Mode

US stocks managed decent gains in March that pushed the large-cap indices back to multi-year highs seen earlier in the month.

The majority of the gains were achieved in the last week of the month when Federal Reserve chairman Ben Bernanke said prolonged weakness in the labor market due to a general shortfall of aggregate demand merited an accommodative monetary policy, a term that was interpreted as an indication of further rounds of quantitative easing, if required.

The monthly job data remained robust and weekly jobless claims in the last week of the month dropped to a level not seen since April 2008. Consumer spending increased at a faster pace though personal income gains were modest, validating Bernanke’s observation of structural weaknesses in the labor market. The University of Michigan consumer sentiment index also hit its highest level.

All was not well on the western front, however, and some weaknesses restricted the stock market rally. A report showed pending home sales dropped in Feb, factory activities slowed down in the Midwest, and durable goods orders did not bounce back as forecast. The final reading of fourth quarter GDP however, came as a breather, showing the economy expanded at 3 percent, as had been widely anticipated.

Large caps generally outperformed the markets due to the predominance of tech companies in the large cap growth companies, and the technology sector has been one of the best performing sectors thus far this year. Also, sectors that performed poorly in 2011, technology, consumer discretionary and financials, have performed very well while defensive sectors such as utilities and consumer staples that led last year have lagged in 2012.

There are risks, however, with European credit crisis spreading to other countries and China slowing down in the coming months. The ECB has been trying to live up to the challenges by providing about a trillion Euro band aid via cheap loans for three years to the region’s banks to avoid a credit crunch witnessed following Lehman Brothers collapse.

Also European finance ministers approved a combined rescue fund of about €720 billion when they met in Copenhagen in the last week of March. That should at least temporarily soothe nerves of those who have been fretting over Spain and Italy drowning the EU region and give some time to get their houses in order. Central banks of Brazil, China and India have either begun to lower official interest rates or have lowered bank reserve requirement rates, releasing money into the system.

Domestically, the housing and employment data have been better compared to what we saw in 2010 and 2011, although much of it has been simply a byproduct of rapid Fed stimulation designed to keep the markets aloft.

What we’ve seen in the market during this first quarter has almost been a carbon copy of the up moves from 2010 and 2011. In case you forgot, the major averages tanked big time during mid-year and were “rescued” each time by another round of Fed easing (QE1 and QE2).

That’s a clear sign to me that the economy and the markets are artificially propped up and sooner or later a sense of realty will pull us off these lofty levels, which may very well result in the next round of stimulus being applied.

However, right now, the markets are heading north, as demonstrated by my Domestic Trend Tracking Index (TTI):

It is obvious that this trajectory is simply not sustainable and some form of a pullback is a given; the timing of it is the unknown. This is why, despite the euphoria on Wall Street, I am committed to our exit strategy for all of our portfolios based on our trailing sell stops.

Based on blog reader feedback I have received, there is great complacency among market participants based on the hope that the Fed will be able to put a floor under any correction. I certainly would not count on it, as continued stimulus efforts will eventually lose their effectiveness.

Equity ETFs Retreat Over Europe Worries; VXX Jumps, GDXJ Lags

Ulli Market Review Contact

[Chart courtesy of MarketWatch.com]

US stocks slipped to their lowest level in nearly a month Wednesday following a weak Spanish bond auctions report that revived the specter of the Greek debt crisis being repeated.

Markets were also spooked as investors remained worried about how markets would react without further monetary stimulus from the Federal Reserve, as the bunch bowl got taken away yesterday, driving Treasuries higher as safe-haven appeal of US debts increased.

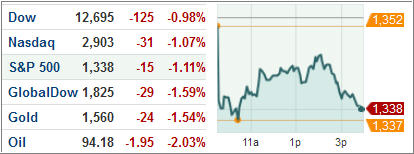
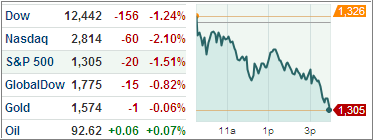
The Dow Jones Industrial Average (DJIA) shed 1 percent as the markets witnessed pull-backs following steady gains made during the first quarter. Payroll processing firm ADP’s report showing a lower-than-expected rise in private-sector jobs in March aggravated the situation further.

Read More

7 ETF Model Portfolios You Can Use – Updated through 4/3/2012

Ulli Model ETF Portfolios Contact

The markets, as measured by the S&P 500, ended unchanged since last week’s ETF portfolio update.

Yesterday’s FOMC minutes disappointed the Wall Street crowd as, for the time being, another round of easing has been postponed until deemed necessary. That pulled the major indexes off their highs but, while the damage was limited in magnitude, both bonds and equities were equally affected.

While most of our model portfolios held steady, #7 gave back almost 1% due to higher interest rates. This may have been only a temporary pullback, but if rates continue to head north, that will not bode well for the continuation of the rally in equities.

Here’s the latest ETF Model Portfolio update:


Read More

Major Market ETFs Retreat On FOMC Minutes; VXX Rises, GAZ Sinks

Ulli Market Review Contact

[Chart courtesy of MarketWatch.com]

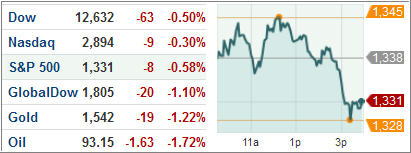
US stocks slipped Tuesday with the Dow Industrials declining for the first time in four days after the minutes from the Federal Reserve Open Market Committee indicated lesser possibility for further monetary stimulus. The markets reminded me of that famous Rolling Stone song “you can’t always get what you want,” as another QE had been expected.

Treasuries sank, pushing 10-year yields to their highest level in more than a week as speculators closed positions after the Fed indicated halting further quantitative easing.

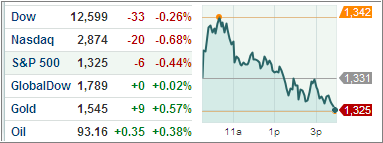
The Dow Jones Industrial Average (DJIA) retreated 0.5 percent to end the day at 13,199.50. Markets witnessed a sell off after speculations over another round of monetary stimulus turned out not to be on the front burner with the Fed. However, last hour buying limited the downside move, as we have seen just about during all recent sell off attempts.

Read More

US Equity ETFs Rally Into The Second Quarter; GAZ Pops, VXX Tanks

Ulli Market Review Contact

[Chart courtesy of MarketWatch.com]

US stocks rallied Monday, extending last week’s advances, after better-than-expected latest domestic manufacturing data stretched Wall Street’s best first quarter since 1998.

The Dow climbed to its highest level since 2007 after the Institute of Supply Management’s index on manufacturing activity rose to 53.4 in March, slightly beating market expectations. The Federal Reserve kept buying debt to cap borrowing costs that would lead to an expanded balance sheet.

The Dow Jones Industrial Average (DJIA) jumped 52.45 points to 13,264.49 after manufacturing report for March showed prices rose lower than forecast, easing immediate inflation worries, while the S&P 500 Index (SPX) added 0.7 percent to 1418.90 with the commodities sector rallying the most.

Read More

ETFs/Mutual Funds On The Cutline – Updated Through 3/30/2012

Ulli ETFs on the Cutline Contact

Below are the latest ETF Cutline reports, which show how far above or below their respective long-term trend lines (39 week SMA) my currently tracked ETFs/MFs are positioned.

The first report covers the ETF Master List from Thursday’s StatSheet and includes 398 ETFs, of which currently 346 (last week 349) of them are hovering in bullish territory.

The second report includes only High Volume ETFs. To clarify, High Volume (HV) ETFs are defined as those with an average daily volume of $10 million or higher.

These ETFs are generated from my selected list of some 93 that I use in my advisor practice. It cuts out the “noise,” which simply means it eliminates those ETFs that I would never buy because of their volume limitations. 72 ETFs (last week 74) have managed to move into in bullish territory after the recent run up.

The third report covers Mutual Funds on the Cutline. There are currently 802 (last week 805) above the line and 59 below it out of the 861 that I follow.

Take a look:

1. ETF Master Cutline Report

2. ETF High Volume Cutline Report

3. MF Cutline Report