ETFs/Mutual Funds On The Cutline – Updated Through 6/1/2012

Ulli ETFs on the Cutline Contact

Below are the latest ETF Cutline reports, which show how far above or below their respective long-term trend lines (39 week SMA) my currently tracked ETFs/MFs are positioned.

The first report covers the ETF Master List from Thursday’s StatSheet and includes 398 ETFs, of which currently 92 (last week 215) of them are hovering in bullish territory.

The second report includes only High Volume ETFs. To clarify, High Volume (HV) ETFs are defined as those with an average daily volume of $10 million or higher.

These ETFs are generated from my selected list of some 93 that I use in my advisor practice. It cuts out the “noise,” which simply means it eliminates those ETFs that I would never buy because of their volume limitations. 14 ETFs (last week 29) have managed to remain in bullish territory after the recent sell off.

The third report covers Mutual Funds on the Cutline. There are currently 126 (last week 551) above the line and 735 below it out of the 861 that I follow.

Take a look:

1. ETF Master Cutline Report

2. ETF High Volume Cutline Report

3. MF Cutline Report

In case you are not familiar with some of the terminology used in the reports, please read the Glossary of Terms.

Last Week In Review: ETF News And Blog Posts To 6/3/2012

Ulli Market Review Contact

In case you missed it, here’s a summary of the ETF topics and market reviews I posted to my blog during the week ending on 6/3/2012.

The roller coaster ride continued with the S&P 500 getting spanked at the tune of -3% over the past week.

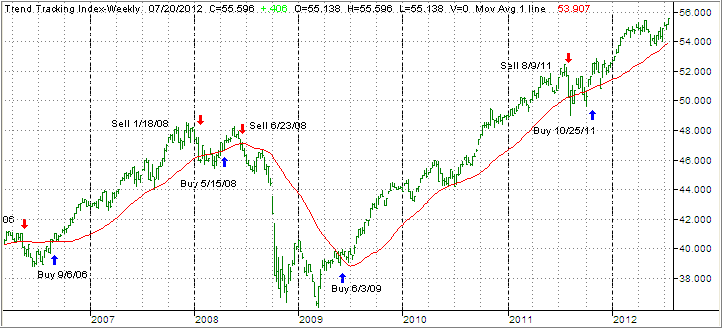
While momentum has clearly shifted downward, with the major indexes dropping below their respective 200-day moving averages, our TTI is still hanging on to the bullish side of the trend line.

Any more downside activity and this indicator is likely to follow the crowd into bear market territory as well. Stay tuned to the blog, since I will be making the announcement here as soon as this crossing of the trend line occurs.

This week, we covered the following:

Read More

Markets Are Overreacting On The Jobs Data; QE3 On The Table: James O’Sullivan

Ulli Market Review Contact

Economist James O’Sullivan is surprised with the market’s reaction to the latest jobs number from the US.

Of course, 69,000 job additions are far less than his projection of 180,000 jobs for May, but markets have overreacted because of the back drop; there’s too much jitter because of the developments in Europe and not to mention the approaching elections.

The latest number is not that bad if one looks at the long-term trend where the US economy has added 174,000 jobs each month over the past six months. It may not be booming, but it does indicate that the economy is doing reasonably well.

Even the manufacturing ISM reading came in below forecasts, but they are still comfortably in the expansionary region. Though the consensus ISM forecast was above 54, the actual reading of 53.5 still indicates manufacturing is expanding. Also the Orders Index reading were more encouraging at 60.1 since it’s an improvement over April. Nonetheless, the reaction was exaggerated since Thursday’s ADP jobs numbers came in softer than anticipated.

Read More

Taking stock – AlphaClone Alternative Alpha Exchange-Traded Fund (ALFA)

Ulli Hedge Fund ETF Contact

The ETF industry already provides investment opportunities in hedge funds, which once were the exclusive domain of the ultra rich.

Well, the choice just got wider as Exchange-Traded Concepts announced the launch of AlphaClone Alternative Alpha Exchange-Traded Fund (ALFA), a fund that seeks to replicate the composition of the AlphaClone Hedge Fund Long/Short Index, a benchmark that tracks the publicly disclosed positions of the hedge funds and institutional investors.

The benchmark is comprised of holdings of managers with highest “Clone Scores”. A Clone Score is a proprietary gauge developed by AlphaClone that measures the effectiveness of following a manager based on their disclosed holdings and incorporates monthly returns in excess of the broad market index (alpha) and a fixed hurdle rate. The equity components are selected from hedge fund managers that have the highest rankings (Clone Scores), which they disclose through regular SEC filings.

Read More

06-01-2012

Ulli Newsletter Archives Contact

ETF/No Load Fund Tracker Newsletter For Friday, June 1, 2012

ETF/No Load Fund Tracker StatSheet

————————————————————-

THE LINK TO OUR CURRENT ETF/MUTUAL FUND STATSHEET IS:

https://theetfbully.com/2012/05/weekly-statsheet-for-the-etfno-load-fund-tracker-newsletter-updated-through-05312012/

————————————————————

Market Commentary

Friday, June 1, 2012

QE3 POSSIBILITY GOES UP AS ECONOMY SHOWS SIGNS OF SLOWDOWN; GDXJ SHINES, ITB TUMBLES

On the first trading day of June, US stocks plummeted by over 2 percent Friday to register the worst day of 2012 with the Dow slipping into the red, wiping off gains for the year after a Labor Department report showed fewer jobs were added than anticipated.

The S&P 500 and the NASDAQ are off more than 10 percent from the year’s highs, moving into the so-called correction territory, as investors sought refuge in gold and Treasuries. Yield on 30-year bond dropped to record lows after the May reading of ISM Manufacturing Index dropped to 53.5 against an estimated 54.

The Dow Jones Industrial Average (DJIA) plummeted 2.2 percent to 12,118.57, the biggest one-day drop since November. The index wiped off all the gains for 2012, trading nearly 100 points lower than the start of the year. All of its 30 components closed lower for the day.

The S&P 500 Index (SPX) slipped 2.5 percent, recording its biggest loss in six months. The index however managed to remain in the positive territory, higher 1.6 percent for the year.

The tech-heavy NASDAQ Composite Index (COMP) lost 2.8 percent to end at 2747.48. The index is still up 5.5 percent year-to-date, thanks to solid gains made in the first quarter.

Treasury yields touched new lows after the Markit Purchasing Managers Index showed European manufacturing activity shrank highest in three years in May. The benchmark 10-year Treasury yields dropped nine basis points to a new all-time low of 1.47 percent in the afternoon trade. Yield on 30-year bonds dropped 10 basis points to 2.54 percent.

ETFs in the news:

As jobs data for May disappointed, Treasuries and gold prices soared, pushing gold miners higher. Among the day’s top gainers, the Van Eck Market Vectors Junior Gold Miners ETF (GDXJ) sizzled, vaulting 6.94 percent for the day. The Van Eck Market Vectors TR Gold Miners (GDX) also moved fast and furious and added 6.4 percent for the day.

Bullion linked funds made progress during the day as the yellow metal breached the $1,600-an-ounce level after weeks. The State Street SPDR Gold Trust (GLD) jumped 3.88 percent for the day as gold futures for August delivery nearly rose 4 percent.

The weaker than expected jobs report for May took its toll on the home builders. The iShares Dow Jones U.S. Home Construction Index Fund (ITB) crashed, losing 6.22 percent for the day. The day’s trading volume was more than twice the average as investors anticipated lower home sales on weak jobs data. However, ITB remains solidly in the positive territory for the year, up more than 20 percent since January.

Other home builder linked products like the State Street SPDR S&P Home builders ETF (XHB) tumbled 5.65 percent after its top holdings PulteGroup and Lennar Corp sank 11.75 percent and 8.32 percent respectively. Despite today’s thrashing, XHB is up 14.27 percent for the year.

The State Street Financial Select Sector SPDR (XLF) featured among the biggest losers, slipping 3.71 percent for the day.

Our Trend Tracking Indexes (TTIs) headed further south as well. Domestically, we remain on the bullish side of the trend line while, internationally, we are sinking deeper into bear territory.

Here are this week’s closing numbers:

Domestic TTI: +1.24% (last week +2.00%)

International TTI: -6.73% (last week -4.24%)

Technically speaking, some serious damage was done, as the S&P 500, the Dow Jones Industrials and the Transportation Index all broke below their widely followed 200-day moving averages, which may invite more selling and which may subsequently push our Domestic TTI over the edge as well.

Not helping matters was the fact the markets showed no rebound ability late in the session, closing at the lows, which does not bode well for next week’s opening.

Speaking of next week, you can expect to hear some howling on the Street for more stimulus as downward momentum appears to accelerate. For the nth time, if you do your own investing, are you executing your trailing sell stops?

Have a great week.

Ulli…

Disclosure: No holdings

————————————————————-

READER Q & A FOR THE WEEK

All Reader Q & A’s are listed at our web site!
Check it out at:

http://www.successful-investment.com/q&a.php

A note from reader Doug:

Q: Ulli: I’ve been following your #1 portfolio based mainly on PRPFX. I’m wondering if the series of drops of PRPFX last week is triggering a sell for you, or are you going to see if it bounces this week?

A: Doug: We came close to selling PRPFX in our model portfolios a week ago. It had dropped -7.25% off its high, but I decided to hold on another day—just like I did with VTI.

I ended up liquidating it on 5/31, as it had reached almost the -7.5% point.

———————————————————-

WOULD YOU LIKE TO HAVE YOUR INVESTMENTS PROFESSIONALLY MANAGED?

Do you have the time to follow our investment plans yourself? If you are a busy professional who would like to have his portfolio managed using our methodology, please contact me directly or get more details at:

https://theetfbully.com/personal-investment-management/

ETF/No Load Fund Tracker Newsletter For Friday, June 1, 2012

Ulli ETF Tracker Contact

ETF/No Load Fund Tracker StatSheet

————————————————————-

THE LINK TO OUR CURRENT ETF/MUTUAL FUND STATSHEET IS:

https://theetfbully.com/2012/05/weekly-statsheet-for-the-etfno-load-fund-tracker-newsletter-updated-through-05312012/

————————————————————

Market Commentary

Friday, June 1, 2012

QE3 POSSIBILITY GOES UP AS ECONOMY SHOWS SIGNS OF SLOWDOWN; GDXJ SHINES, ITB TUMBLES

On the first trading day of June, US stocks plummeted by over 2 percent Friday to register the worst day of 2012 with the Dow slipping into the red, wiping off gains for the year after a Labor Department report showed fewer jobs were added than anticipated.

The S&P 500 and the NASDAQ are off more than 10 percent from the year’s highs, moving into the so-called correction territory, as investors sought refuge in gold and Treasuries. Yield on 30-year bond dropped to record lows after the May reading of ISM Manufacturing Index dropped to 53.5 against an estimated 54.

The Dow Jones Industrial Average (DJIA) plummeted 2.2 percent to 12,118.57, the biggest one-day drop since November. The index wiped off all the gains for 2012, trading nearly 100 points lower than the start of the year. All of its 30 components closed lower for the day.

Read More