New ETFs On The Block: PowerShares S&P 500 Low Volatility Portfolio (SPLV)

Ulli Low Volatility ETFs Contact

If you recognize the long-term value in the S&P 500 stocks, yet are adverse to volatility, you may consider using the S&P 500 Low Volatility Portfolio (SPLV) as opposed to SPY or the broad VTI.

SPLV tracks the S&P Low Volatility Index and includes 100 stocks from the benchmark’s 500 with the lowest realized volatility over the past 12 months. If you want to maintain exposure in domestic equities without going so far as to invest in cash or Treasuries, or minimize whipsaw signals if you work with trailing stop losses, you may find SPLV attractive.

This ETF seeks to invest a minimum 90 percent of total assets in common stocks that comprise the index. The underlying index is volatility weighted and the ETF re-balances every quarter in February, May, August and November.

SPLV concentrates its investment, i.e. invests more than 25 percent or more of the value of its total assets in a single issuer to the extent that the underlying index reflects a concentration in that issuer. The fund has maximum exposures in large-cap growth, large cap value and mid-cap value stocks.

Read More

08-17-2012

Ulli Newsletter Archives Contact

ETF/No Load Fund Tracker Newsletter For Friday, August 17, 2012

ETF/No Load Fund Tracker StatSheet

————————————————————-

THE LINK TO OUR CURRENT ETF/MUTUAL FUND STATSHEET IS:

https://theetfbully.com/2012/08/weekly-statsheet-for-the-etfno-load-fund-tracker-newsletter-updated-through-08162012/

————————————————————

Market Commentary

Friday, August 17, 2012

MAJOR INDEXES END HIGHER FOR SIXTH STRAIGHT WEEK ON IMPROVED SENTIMENT; EUROPE FOLLOWS SUIT

US stocks capped off gains for the sixth week in a row Friday as broad markets maintained the positive momentum after latest reports suggested consumer sentiment improved in August.

The University of Michigan Thomson Reuters consumer sentiment index advanced to 73.6 in August from 72.3 in July, beating projections of a decline. Leading economic indicators climbed 0.4 percent in July, the latest Conference Board report showed.

The Dow Jones Industrial Average (DJIA) closed 0.5 percent higher for the week, its sixth straight week of gains. Within the Dow, only 13 of the 30 components closed higher as breadth turned negative for the day.

The S&P 500 Index added 0.9 percent for the week, following the Dow with six consecutive up weeks, the longest since Jan 2011. Tech and financials rose the most on the day among its 10 business groups.

Government securities headed for the fourth down week in a row, even though US Treasuries snapped a 4-day long losing streak despite Friday’s consumer confidence number beating analysts’ estimates.

The latest reading follows similar up-trends in jobs, retail sales, industrial production and building permits indicating a slow recovery.

Robust US consumer confidence had a positive effect on the greenback, pushing the dollar up against the euro Friday. However, the single-currency gained against the yen, hitting the highest since June over hopes the EU leaders will save the common currency zone.

German Chancellor Merkel said Berlin remained in tune with the single-currency project that indicated her changed position over backing ECB President Mario Draghi on restarting the peripheral bond purchase program.

European stocks rallied Friday, taking cue from improved US consumer sentiment. Led by the banking sector, the Stoxx Europe 600 index rose 0.6 percent on the day. However, speculation over a possible Greece exit gained momentum after Finnish Foreign Minister Erkki Tuomioja said the eurozone should openly face the possibility of a euro breakup.

In the ETF universe, platinum and palladium ETFs spiked after deadly clashes between workers and police in UK-based Lonmin Plc’s Marikana platinum mines left 34 dead and more than 70 injured.

The ETF Securities Physical Palladium Shares (PALL) surged 4.23 percent while the UBS E-TRACS UBS Long Platinum ETN (PTM) jumped 3.22 percent. The ETF Securities’ Physical Platinum Shares (PPLT) also pushed higher, closing 2.21 percent on the day. Today’s rally was an event-driven reaction to possible supply disruption in future, analysts pointed out.

Our Trend Tracking Indexes (TTIs) pretty much repeated last week’s trend with the International TTI now having solidly moved into bullish territory. Absent any sharp reversal on Monday, a new ‘Buy’ signal will be generated for that area.

Here’s how we ended the week:

Domestic TTI: +3.05% (last week +3.10%)

International TTI: +2.34% (last week +1.56%)

Have a great week.

Ulli…

Disclosure: No holdings

————————————————————-

READER Q & A FOR THE WEEK

All Reader Q & A’s are listed at our web site!
Check it out at:

http://www.successful-investment.com/q&a.php

A note from reader Jim:

Q: Ulli: I saw a question from Larry on August 10 asking how to decide what to buy and you referred him to your 7 model portfolios. When I look at them, I see holds and sells but no buys. Do holds mean that they are at good price points to buy currently?

Thank you for your site.

A: Jim: Well, the models show the dates when we initiated the original positions, the current gain/loss and the time we got stopped out when our trailing sell stops kicked in. The “hold” column refers to those positions that have not been stopped out.

If you view Thursday’s StatSheet, you can see which areas are in a ‘buy’ and which areas are in ‘sell’ mode in accordance with our Trend Tracking indexes. The featured tables are the ones you would select new positions from, if you are so inclined.

Personally, I would not add any volatile equities at these lofty levels, but that decision is strictly a matter of your personal risk tolerance.

———————————————————-

WOULD YOU LIKE TO HAVE YOUR INVESTMENTS PROFESSIONALLY MANAGED?

Do you have the time to follow our investment plans yourself? If you are a busy professional who would like to have his portfolio managed using our methodology, please contact me directly or get more details at:

https://theetfbully.com/personal-investment-management/

———————————————————

Back issues of the ETF/No Load Fund Tracker are available on the web at:

https://theetfbully.com/newsletter-archives/

ETF/No Load Fund Tracker Newsletter For Friday, August 17, 2012

Ulli Market Commentary Contact

ETF/No Load Fund Tracker StatSheet

————————————————————-

THE LINK TO OUR CURRENT ETF/MUTUAL FUND STATSHEET IS:

https://theetfbully.com/2012/08/weekly-statsheet-for-the-etfno-load-fund-tracker-newsletter-updated-through-08162012/

————————————————————

Market Commentary

Friday, August 17, 2012

MAJOR INDEXES END HIGHER FOR SIXTH STRAIGHT WEEK ON IMPROVED SENTIMENT; EUROPE FOLLOWS SUIT

US stocks capped off gains for the sixth week in a row Friday as broad markets maintained the positive momentum after latest reports suggested consumer sentiment improved in August.

The University of Michigan Thomson Reuters consumer sentiment index advanced to 73.6 in August from 72.3 in July, beating projections of a decline. Leading economic indicators climbed 0.4 percent in July, the latest Conference Board report showed.

The Dow Jones Industrial Average (DJIA) closed 0.5 percent higher for the week, its sixth straight week of gains. Within the Dow, only 13 of the 30 components closed higher as breadth turned negative for the day.

The S&P 500 Index added 0.9 percent for the week, following the Dow with six consecutive up weeks, the longest since Jan 2011. Tech and financials rose the most on the day among its 10 business groups.

Government securities headed for the fourth down week in a row, even though US Treasuries snapped a 4-day long losing streak despite Friday’s consumer confidence number beating analysts’ estimates.

The latest reading follows similar up-trends in jobs, retail sales, industrial production and building permits indicating a slow recovery.

Read More

Weekly StatSheet For The ETF/No Load Fund Tracker Newsletter – Updated Through 08/16/2012

Ulli ETF StatSheet Contact

ETF/Mutual Fund Data updated through Thursday, August 16, 2012

If you are not familiar with some of the terminology used, please see the Glossary of Terms.


1. DOMESTIC EQUITY MUTUAL FUNDS/ETFs: BUY — since 10/25/2011

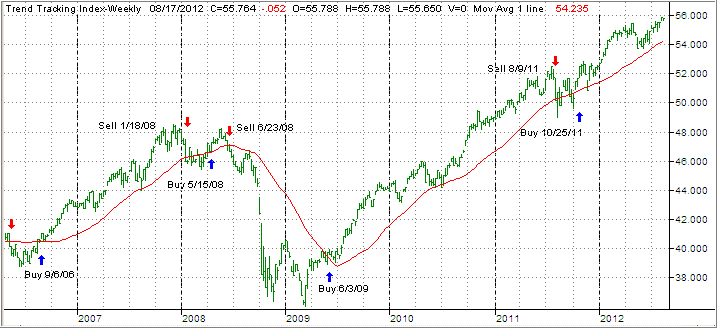
The domestic TTI broke through its long-term trend line generating a Sell for this area effective 8/9/2011. Over the recent past, we’ve seen the TTI hovering slightly below and above this dividing line between bullish and bearish territory. The clear break to the upside occurred on 10/24/11 and, effective 10/25/11, a new Buy signal for domestic equities went into effect.

As of today, our Trend Tracking Index (TTI—green line in above chart) has broken above its long term trend line (red) by +3.00%. A break back below it will generate a Sell signal to move out of all domestic equity positions. Be sure to tune into my blog for the latest updates.

Read More

Cisco Pulls Equities Out Of Trading Range; German Chancellor Merkel Assists

Ulli Market Commentary Contact

[Chart courtesy of MarketWatch.com]

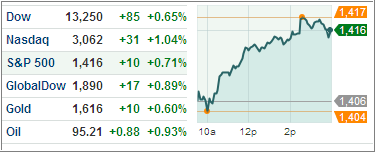
Boosted by solid tech and housing data, US stocks rallied Thursday with the S&P 500 hitting its highest level since April even though regional manufacturing data remained mostly disappointing. Angela Merkel provided additional support to the markets after the German Chancellor said Berlin remains committed to the single currency during a trip to Canada.

All the three indexes ended higher after the tech sector went into overdrive following strong performance by network equipment manufacturer Cisco Systems in the second quarter. The tech-laden NASDAQ gained the most, adding about one percent on the day.

In their typical facicious way, ZeroHedge served up the following spot on comment:

Read More

Uneven Data Keeps Major Indexes Range Bound; Will QE-3 Happen In September?

Ulli Market Commentary Contact

[Chart courtesy of MarketWatch.com]

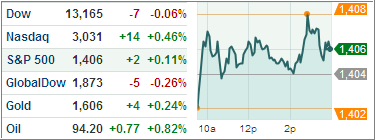
US stocks remained near flat Wednesday while the blue-chip stocks closed slightly lower as investors weighed mixed economic data amid diminished hopes for further monetary expansion measures from the US Fed.

The Dow Jones closed lower while the S&P 500 and the NASDAQ Composite managed to hang on to marginal gains even though volumes continue to remain weak.

The dollar tracked higher, pushing the euro to its lowest level since July 30 as improved US economic data trimmed chances of further quantitative easing by the Fed. The dollar index, a measure of the greenback’s strength against a basket of six leading currencies, continued to march ahead, trading at 82.649 against Tuesday’s 82.540 after a Federal Reserve report showed industrial production grew at a faster-than-anticipated rate of 0.6 percent in July.

The big question remains as to whether there will be more QE in September. For a straight forward opinion, please tune in to the Fed’s Richard Fisher’s frank interview on CNBC:

Read More