ETF/No Load Fund Tracker Newsletter For Friday, November 9, 2012
ETF/No Load Fund Tracker StatSheet
————————————————————-
THE LINK TO OUR CURRENT ETF/MUTUAL FUND STATSHEET IS:
https://theetfbully.com/2012/11/weekly-statsheet-for-the-etfno-load-fund-tracker-newsletter-updated-through-11082012/
————————————————————
Market Commentary
Friday, November 9, 2012
MAJOR INDEXES SNAP LOSING STREAK BUT SUFFER THEIR WORST LOSS IN 5 MONTHS; EUROPE SLIPS ON GREECE WORRIES
US equities eked out modest gains Friday spurred by a strong read on American consumer confidence, but all the three major equity averages still finished lower more than two percent for the week.
After starting to the downside on what appeared to be a third straight session of losses, stock indexes recovered as preliminary consumer confidence data from the University of Michigan for November came in at 84.9, topping forecasts of 82 and up from 82.6 in October.
The Dow Jones Industrial Average (DJIA) nudged up 4 points to 12,815, snapping a two-day losing streak. Breadth within the 30-stock benchmark turned positive with winners outpacing losers 18 to 12 on the blue-chip index.
Logging a 2.1 percent weekly loss that also marked its third straight down week, the Dow posted its worst weekly performance in nearly five months. The S&P 500 Index (SPX) rose 2 points to 1380, still down 2.4 percent for the week.
The benchmark 10-year Treasury yield was little changed at 1.61 percent while yield on 30-year Treasury bonds fell one basis point to 2.75 percent. 10-year yields have dropped 10 basis points on the week while 30-year yields are at a two month low.
The US dollar advanced for the third day as worries over a potential political gridlock over fiscal policies spiked demand for safer assets. The euro edged lower as hopes for an early decision to release Greece’s next tranche of bailout money faded after news reports suggested continued differences among euro-zone’s finance ministers that may push back a decision until later this month.
Meanwhile, European stocks retreated Friday, capping losses at 1.7 percent in an otherwise volatile trading week. The pan-European Stoxx Europe 600 index slipped 0.1 percent, extending losses into the third straight day. Early optimism over strong industrial output and retail sales in China was offset by growth worries over France.
A monthly report from the Bank of France said Europe’s second largest economy runs the risk of slipping into recession as economic output may decline by 0.1 percent in the fourth quarter.
Also Greece’s parliament will vote Sunday on its 2013 budget after approving an additional EUR 13.5 billion in austerity measures earlier this week. The Athens General Index jumped 0.9 percent, cutting losses to 0.1 percent for the week.
Dragged down by banking shares, the DAX 30 index lost 0.6 percent in Frankfurt, off 2.7 percent for the week. Commerzbank AG sank 6.9 percent while Deutsche Bank lost 2.4 percent.
In the ETF space, the SPDR S&P Biotech ETF (XBI) surged 2.19 percent as biotech, semiconductor and internet stocks rallied today. Also energy commodities traded mostly higher as oil prices breached the $86 a barrel mark. The United States Oil Fund (USO) finished 1.44 percent higher for the day.
The Teucrium Soybean Fund (SOYB) tumbled 2.49 percent after US Agriculture Department predicted a rise in production, pushing soybean futures price crashing.
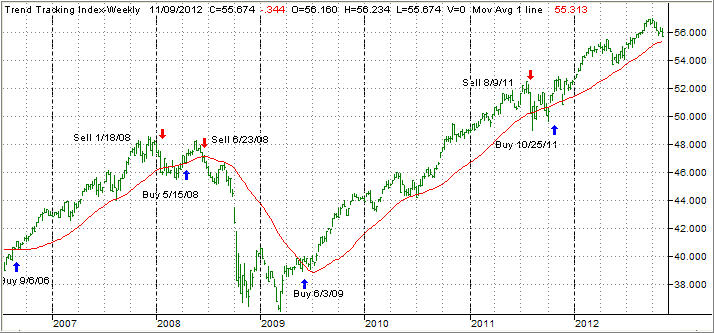
Our Trend Tracking Indexes (TTIs) headed closer to a potential trend line break, which so far did not happen. Any more slipping and sliding in the indexes will most certainly end this bullish domestic cycle and very likely the international one as well.
Stay tuned for the latest details, which I will post on a daily basis.
We ended the week as follows:
Domestic TTI: +0.72% (last week +1.34%)
International TTI: +1.45% (last week +3.24%)
Have a great week.
Ulli…
Disclosure: No holdings in ETFs discussed above
————————————————————-
READER Q & A FOR THE WEEK
All Reader Q & A’s are listed at our web site!
Check it out at:
http://www.successful-investment.com/q&a.php
A note from reader Joe:
Q: Ulli: With the markets being in a tizzy fit and your TTIs getting close to triggering a ‘Sell,’ do you recommend establishing new positions for new money at this time?
A: Joe: Here’s how I handle it in my advisor practice. Since new money comes in all the time, I select the portfolios I want to use (right now, it’s some variation of model #2) and establish all bond positions, since they are in a “buy” mode.
Depending on the client, I may even set up a small equity holding to get started. I will now wait to see how market direction plays out before investing the balance in equity ETFs.
———————————————————-
WOULD YOU LIKE TO HAVE YOUR INVESTMENTS PROFESSIONALLY MANAGED?
Do you have the time to follow our investment plans yourself? If you are a busy professional who would like to have his portfolio managed using our methodology, please contact me directly or get more details at:
https://theetfbully.com/personal-investment-management/
———————————————————
Back issues of the ETF/No Load Fund Tracker are available on the web at:
https://theetfbully.com/newsletter-archives/