ETF/No Load Fund Tracker Newsletter For Friday, April 19, 2013

Ulli ETF Tracker Contact

ETF/No Load Fund Tracker StatSheet

————————————————————-

THE LINK TO OUR CURRENT ETF/MUTUAL FUND STATSHEET IS:

https://theetfbully.com/2013/04/weekly-statsheet-for-the-etfno-load-fund-tracker-newsletter-updated-through-04182013/

————————————————————

Market Commentary

Friday, April 19, 2013

STOCK INDEXES GAIN, BUT IT REMAINS WORST WEEK OF 2013

Stocks entered the weekend on a mixed note. The major averages were able to pare early session losses and close the trading day higher. However, the Dow Jones Industrial Average lagged behind other indices. It added 10 points (0.1%) to 14,548; the Nasdaq Composite ascended 40 points (1.3%) to 3,206; and the S&P 500 Index was up 14 points (0.9%) to 1,555, but the gains weren’t enough to stop the S&P 500 from suffering its worst week since November.

Friday’s trading volume was the lowest of the week but in line with the average for the year. Much of Boston, home to a number of the country’s biggest mutual fund companies, was under virtual lockdown as police mounted house-to-house searches for the Marathon’s bombing suspect.

With the market rebounding broadly, seven of 10 sectors ended with gains of at least 1.0%. Energy, technology, and industrials were the only three sectors which lagged. The energy space ended flat as crude oil added 0.2% to $88.20. Tech shares were pressured by IBM’s disappointing earnings, despite Google and Microsoft beating earnings. The industrial space was the third notable laggard as General Electric weighed. GE shares fell 3.7% in the afternoon, trading just above its 200-day moving average after falling below that line intraday, because revenue was down a bit from last year and profit just met forecast. GE saw significant pressure as conditions weakened further in Europe with industrial segment revenues in the region down 17%.
Read More

Weekly StatSheet For The ETF/No Load Fund Tracker Newsletter – Updated Through 04/18/2013

Ulli ETF StatSheet Contact

ETF/Mutual Fund Data updated through Thursday, April 18, 2013

Table of Content082312

If you are not familiar with some of the terminology used, please see the Glossary of Terms.


1. DOMESTIC EQUITY MUTUAL FUNDS/ETFs: BUY — since 10/25/2011

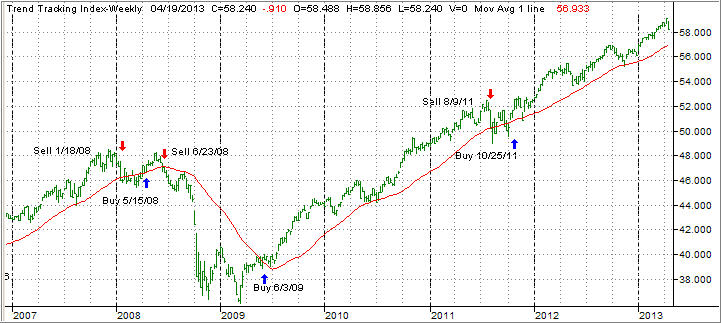
TTI

The domestic TTI broke through its long-term trend line generating a Sell for this area effective 8/9/2011. Over the recent past, we’ve seen the TTI hovering slightly below and above this dividing line between bullish and bearish territory. The clear break to the upside occurred on 10/24/11 and, effective 10/25/11, a new Buy signal for domestic equities went into effect.

As of today, our Trend Tracking Index (TTI—green line in above chart) has bounced off its long term trend line (red) by +2.43% as part of the post election rebound.

To avoid a potential whip-saw, a Sell signal to move out of all domestic equity positions will be generated once we have clearly pierced the line to the downside. Be sure to tune into my blog for the latest updates.

Read More

Market Follows Declining Volume

Ulli Market Commentary Contact

Thur pic

[Chart courtesy of MarketWatch.com]

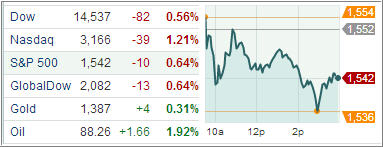
Equity indexes took another hit on Thursday and ended lower across the board. Sellers were in control and buyers were nowhere to be found as most earnings reports failed to impress and the latest round of manufacturing data left disappointment.

The Dow Jones industrial average slid 0.56 percent while the Standard & Poor’s 500 Index dropped 0.67 percent, to finish at its lowest in six weeks. Seven of the 10 main S&P 500 industries declined today as technology, health-care and consumer-discretionary companies fell the most, sinking at least 1.1 percent.

Manufacturing activity in the mid-Atlantic region, the area covering eastern Pennsylvania, southern New Jersey and Delaware, softened in April, sending the Philadelphia Fed’s monthly manufacturing survey lower to 1.3 from 2 the prior month. Economists had projected a 3.0 gain.

In a separate report, weekly jobless claims rose to 352,000 last week, above expectations for 347,000. The index of U.S. leading indicators unexpectedly declined in March, adding to evidence the economy will cool. While the world’s largest economy is losing some momentum from the effects of a payroll tax increase and concern over federal budget cuts, consumers, globally, are retrenching as well.

Read More

Down, Up, And Down Again…

Ulli Market Commentary Contact

Wed pic

[Chart courtesy of MarketWatch.com]

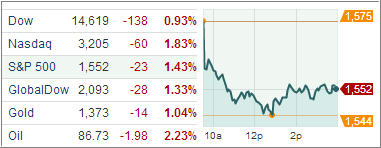
Domestic equities closed sharply lower across the board today, with all sectors in the red, amid disappointing quarterly results by a batch of companies from Bank of America Corp. to Textron Inc., while commodities resumed their selloff because of ongoing worries over global growth; or lack thereof.

The Standard & Poor’s 500 Index declined 1.4 percent and erased all of yesterday’s gain. All 10 groups in the index declined as energy, technology and financial shares dropped the most. The Dow Jones industrial average was down 0.82 percent, which was its third-straight day of triple-digit moves.

The Nasdaq Composite Index suffered a 1.75 percent loss. Monday marked the sharpest one-day drop this year for all three major averages, before recovering most of those losses on Tuesday. With these sessions’ declines, the market is en route for its biggest weekly loss of 2013.

Read More

7 ETF Model Portfolios You Can Use – Updated through 4/16/2013

Ulli Model ETF Portfolios Contact

Monday’s dump fest was a stark reminder that all is not well in equity land and that the S&P’s 1,600 level, which was almost reached last week, still needs continue upward momentum before it will be conquered.

Yesterday’s strong rebound, during which some our low volatility ETFs took out their previous highs, makes it easy to forget black Monday. Since last week’s ETF Model Portfolio report, the S&P managed to gain some 6 points while some of our models gained as well and others lost.

It’s no secret that the precious metals (PM) having a heck of time as they got taken out to the barn for a severe spanking over the past few trading days. Despite yesterday’s bounce, the jury is still out as to whether that was simply a dead cat bounce for PMs and equities alike or the continuation of the prior trend.

We are living not only in uncertain times, based on the ongoing federal stimulus, but also in times where unintended consequences can easily derail the best laid plans of the central planners. That means you always have to be alert and ready to execute your exit strategy should market momentum stall and head in the other direction.

In the meantime, here is the latest update for our Model ETF Portfolios, which you can use based on your risk tolerance:

Read More

The Day After… Index ETFs Recover From The Slump

Ulli Market Commentary Contact

Tue pic

[Chart courtesy of MarketWatch.com]

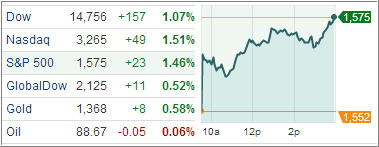
The market quietly opened higher today as the nation is still in shock of the bombings in Boston. Equities snapped back Tuesday after Monday’s nasty sell-off, cheered by better-than-expected March housing starts and a tame reading on consumer prices.

The Nasdaq led the way, rising 1.51%; the Standard & Poor’s 500 Index added 1.46%, rebounding from its biggest drop since November; and the Dow Jones Industrial Average picked up 1.1%. Early data showed NYSE and Nasdaq volume coming in lower than Monday, consistent with the market’s recent pattern of higher-volume declines and lower-volume gains.

All 10 industry groups advanced as raw-materials and consumer-staples companies gained the most, rising at least 1.7 percent thanks to two blue-chip companies announcing better than estimated earnings. Coca-Cola jumped 5.7 percent as Latin American sales volume increased. Johnson & Johnson added 2.1 percent as new drugs and the acquisition of Synthes Inc. boosted sales.

Read More