ETF/No Load Fund Tracker Newsletter For Friday, February 8, 2013
ETF/No Load Fund Tracker StatSheet
————————————————————-
THE LINK TO OUR CURRENT ETF/MUTUAL FUND STATSHEET IS:
https://theetfbully.com/2013/02/weekly-statsheet-for-the-etfno-load-fund-tracker-newsletter-updated-through-02072013/
————————————————————
Market Commentary
Friday, February 8, 2013
US AND EUROPE RISE ON TRADE DATA
US stocks advanced Friday on strong trade data, pushing the S&P 500 to the highest level since November 2007 though the Dow Industrials retreated for the week, snapping a five-week long winning streak.
Stocks received some support from economic data in early trade. A report by the Commerce Department showed trade deficit narrowed to $38.5 billion in December from $48.6 billion in the previous month, thanks to record exports of petroleum products. Today’s better-than-expected trade data may lead to revisions of fourth-quarter GDP numbers into positive territory.
Trade data released by China’s customs administration showed exports jumped 25 percent and imports climbed 29 percent, adding to evidence of a growth rebound in the world’s second largest economy.
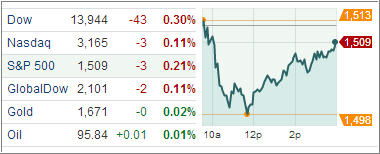
The Dow Jones Industrial Average (DJIA) rose 49 points to 13,993, after rising to an intraday high of 14,022 though it recorded its first weekly decline in six, dropping 0.1 percent for the week while the S&P 500 Index (SPX) added 9 points and climbed 0.3 percent.
Treasuries were little changed on Friday though the benchmark 10-yield posted its biggest weekly decline since November after political leaders agreed to trim the European Union budget, adding to concern that the world’s largest trading bloc will struggle to expand, spurring demand for safe-haven assets.
European stocks surged ahead Friday after robust trade data from the US and China boosted risk sentiment, with banks leading the northward march.
The Stoxx Europe 600 index added 1.2 percent to close at 287.34. Friday’s jump, however, was not good enough to push the index in the green territory for the week and the pan-European index extended losses for the second straight week.
In the ETF space, the Market Vectors Vietnam ETF (VNM) was one of the biggest gainers, adding 3.05 percent for the day.
The Invesco Powershares QQQ Trust Series (QQQ) also jumped, adding 1.03 percent for the day.
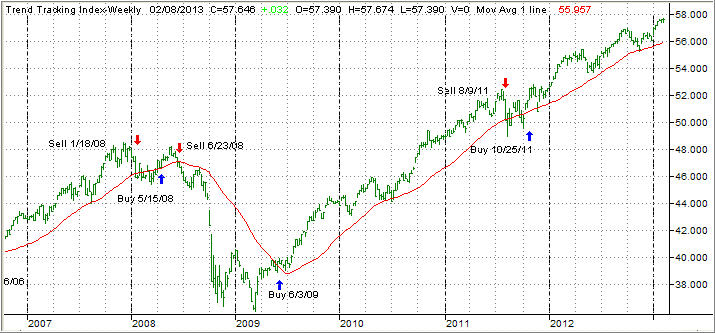
Our Trend Tracking Indexes (TTIs) offered a mixed picture as the Domestic TTI headed higher while the International TTI retreated. Both closed the day as follows:
Domestic TTI: +3.35% (last week +3.23%)
International TTI: +11.04% (last week +12.31%)
Have a great week.
Ulli…
————————————————————-
READER Q & A FOR THE WEEK
All Reader Q & A’s are listed at our web site!
Check it out at:
http://www.successful-investment.com/q&a.php
A note from reader John:
Q: Ulli: I’m in the UK and really appreciate your insights to the market in general. I have a question – when do you add to positions? Do you wait for the market to pull back or would you, for example, add funds on a monthly basis. If so would you do so at the moment with markets so over extended? Hope you can help.
A: John: Well, the ideal time is always at the beginning of a buy cycle. However, once time has passed, I try to add new money on down days. Say, we are in bullish territory with my TTI, and I want to add some more VTI, then I would wait for a day when equities are pulling back and place my order at that time.
If I am looking to add a bond position, I use the same approach in that I look for a down day in bonds. For most investors, I recommend a balanced portfolio as opposed to an outright equity one. While it gives you a lesser return, it also decreases the risk quite a bit.
Personally, I am not in favor of adding small amounts on a monthly basis. My preference is to wait until I have say $5k or more and then invest it in a fund/ETF that is appropriate at the time. Again, there is no right or wrong; it’s simply my preference.
———————————————————-
WOULD YOU LIKE TO HAVE YOUR INVESTMENTS PROFESSIONALLY MANAGED?
Do you have the time to follow our investment plans yourself? If you are a busy professional who would like to have his portfolio managed using our methodology, please contact me directly or get more details at:
https://theetfbully.com/personal-investment-management/
———————————————————
Back issues of the ETF/No Load Fund Tracker are available on the web at:
https://theetfbully.com/newsletter-archives/

 Many believe the robust housing data signals a long-term recovery in the struggling housing market and is a bright spot in the overall broader domestic economic recovery.