
US Indexes Retreat On Disappointing Data; Europe Tracks Lower

Ulli Market Commentary Contact

Wed pic

[Chart courtesy of MarketWatch.com]

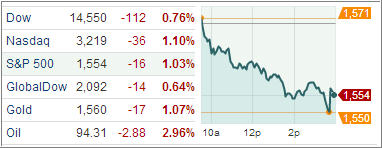
US equities headed sharply downhill, with benchmark indexes sliding to their lowest levels in more than five weeks as oil prices plunged and labor market data disappointed, spurring concern on economic growth ahead of Friday’s all-important nonfarm payrolls report.

Before markets opened, New Jersey-based private payroll-processor ADP Research Institute reported companies hired 158,000 workers in March, well below expectations for a 200,000 increase and versus an upwardly revised gain of 237,000 in February.

The data came before Friday’s non-farm payrolls report from the Labor Department, which is expected to show employers hired about 195,000 workers for the month.

Equities continued their slide after the release of a gauge of the US services sector. The Institute for Supply Management’s index of non-manufacturing businesses, which covers almost 90 percent of the economy, slipped to 54.4 in March from 56 the month before.
Read More

7 ETF Model Portfolios You Can Use – Updated through 4/2/2013

Ulli Model ETF Portfolios Contact

While the S&P 500 only gained 0.38% since last week’s ETF Model Portfolio report, it was a gain nonetheless. With metals tanking and bond prices sinking, it has become clear that the Fed’s primary goal is to continue to lift the equity indexes so that we all can feel the wealth effect and consequently engage in rampant spending to prop up the ailing economy—or so the theory goes.

As I posted before, bond ETFs have gone nowhere this year, which is why we have eliminated most of them for our managed account clients. I have found that the most appropriate holdings in this environment are low volatility ETFs, many of which have outperformed the major indexes by a good margin YTD.

The low volatility part will help us to stay on board a while longer should the next correction turn out to be fairly shallow and followed by the dip-buying-crowd pushing the indexes back up to higher levels.

In the meantime, here is the latest update for our Model ETF Portfolios, which you can use based on your risk tolerance:

Read More

DIA And SPY Close At Record Highs Amid Factory Orders, Cyprus Deal; Europe Rallies

Ulli Uncategorized Contact

Tue pic

[Chart courtesy of MarketWatch.com]

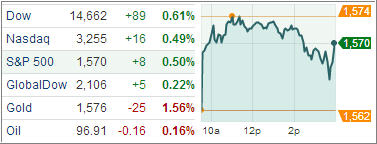
US stock index ETFs closed higher on Tuesday, with the Dow industrials and S&P 500 finishing at record closing highs as US factory orders topped estimates and health insurers rallied after winning an increase in a key Medicare payment rate.

Factory orders rose by three percent in February, boosted by demands for commercial aircraft and automobiles. That was the biggest gain five months and followed a revised one percent decline in January, a Commerce Department report showed.

Insurers rallied after the government gave up plans to cut payments for private Medicare Advantage insurers by 2.3 percent and said it would hike them by 3.3 percent next year instead.

In Europe, the Cyprus government completed talks with the so-called troika of lenders – the European Union, the European Central Bank and the International Monetary Fund. The island nation was granted two extra years, until 2018, to meet the targets linked to its bailout. The new deal will be discussed at a meeting of euro-area finance officials on April 4th.

Read More

Indexes Slip On Manufacturing Data; Treasuries Advance To Almost 4-Week High

Ulli Market Commentary Contact

Mon pic

[Chart courtesy of MarketWatch.com]

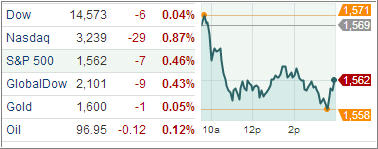
US equity markets started the second quarter on a cautious note, with two benchmark indexes retreating from record highs, after a closely watched manufacturing index declined unexpectedly in March.

The Tempe, Arizona-based Institute for Supply Management’s factory index fell to 51.3 in March from 54.2 in February. Any reading above 50 signals expansion. At the same time, the new-orders index, a gauge of future demand, fell to 51.4 from 57.8 in February.  The production index dropped 5.4 percent to 52.2. The loss of momentum in sales and production could be an indication of an economic slowdown in the second quarter.

Economists expect growth to slow to 2.2 percent from an estimated 2.8 percent in the first quarter.

Read More

ETFs/Mutual Funds On The Cutline – Updated Through 3/28/2013

Ulli ETFs on the Cutline Contact

Below are the latest ETF Cutline reports, which show how far above or below their respective long-term trend lines (39 week SMA) my currently tracked ETFs/MFs are positioned.

The first report covers the ETF Master List from Thursday’s StatSheet and includes 398 ETFs, of which currently 349 (last week 343) of them are hovering in bullish territory.

The second report includes only High Volume ETFs. To clarify, High Volume (HV) ETFs are defined as those with an average daily volume of $10 million or higher.

These ETFs are generated from my selected list of some 93 that I use in my advisor practice. It cuts out the “noise,” which simply means it eliminates those ETFs that I would never buy because of their volume limitations. 75 ETFs (last week 70) have managed to remain in bullish territory after the recent market volatility.

The third report covers Mutual Funds on the Cutline. There are currently 812 (last week 815) above the line and 47 below it out of the 859 that I follow.

Take a look:

1. ETF Master Cutline Report

2. ETF High Volume Cutline Report

3. MF Cutline Report

In case you are not familiar with some of the terminology used in the reports, please read the Glossary of Terms.

Last Week In Review: ETF News And Blog Posts To 3/31/2013

Ulli Market Review Contact

In case you missed it, here’s a summary of the ETF topics and market reviews I posted to my blog during the week ending on 3/31/2013.

Despite the uncertainty and questionable outcome of the Cyprus debacle, the US markets only took a short breather before continuing their relentless match towards higher milestones. The S&P 500 finally hit pay dirt on Thursday by taking out its 2007 all-time high.
What that means is that if you were unfortunate enough to have bought the index on that day in 2007, you have now, 6 years later, finally broken even. Congratulations!

With the Fed continuing the monetization of our debt at the rate of $85 billion a month, with no indication of slowing down, some of that money finds a new home in the stock market acting as the driver to push these indexes towards “out of touch with reality” levels.

Eventually, this market orgy will end, but the timing of it is still unknown. In the meantime, we will continue holding our positions in low volatility ETFs subject to our trailing sell stop discipline, which will take us out of the market when a trend reversal finally makes an appearance.

As an aside, in terms of ETFs, low volatility does not equate with sub-par performance. There are several that have outperformed the indexes YTD by a considerable margin.

Over past week, we covered the following:

Read More