
Bears Feast On Fed’s News

Ulli Market Commentary Contact

Wed pic

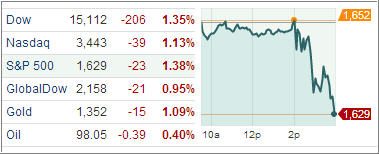
[Chart courtesy of MarketWatch.com]

Concluding the Federal Open Market Committee’s (FOMC) monetary policy 2-day meeting, Federal Reserve Chairman Ben Bernanke held a press conference and appeared to have hinted that the days of easing may be nearing an end.

The statement from the FOMC was released ahead of the press conference wherein the Fed left the target fed funds rate unchanged near zero and maintained its mortgage-backed securities purchases at a pace of $40 billion per month and longer-term Treasury securities at a pace of $45 billion per month. Stocks finished solidly lower following the news.

The Dow Jones Industrial Average plunged 206 points (1.4%) to 15,112, the Standard & Poor’s 500 Index tumbled 23 points (1.4%), the most in two weeks, to 1,629, and the Nasdaq Composite declined 39 points (1.1%) to 3,443.

Today’s Statement indicated inflation has been running below the longer-run objective while long-term inflation expectations remain stable. During his remarks, Chairman Bernanke said if conditions continue to improve, the Fed could reduce the pace of purchases later this year with a potential end to purchases coming in the middle of 2014.
Read More

7 ETF Model Portfolios You Can Use – Updated through 6/18/2013

Ulli Model ETF Portfolios Contact

After the prior week’s volatility, some calmness returned to the markets as renewed upward momentum helped the S&P 500 to gain some 1.6% since the last ETF Model Portfolio report.

Bonds are still showing weakness as interest rates have been inching higher, but equities have largely ignored that fact. More in regards to market direction should be known later on today when the Fed concludes its two-day meeting on interest rates.

The outcome and language used in regards to possibly slowing down monetary policy may have a profound impact on the markets. As I posted before, bond ETFs and the metals have been the losers YTD while equities have been on a tear.

Here’s the latest ETF Model Portfolio update:

Read More

Markets in Cheery Mood—Keep Up Gains

Ulli Market Commentary Contact

Tue pic

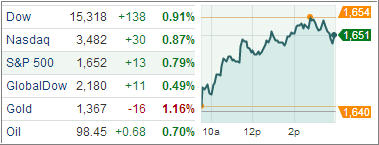
[Chart courtesy of MarketWatch.com]

The Major Equity Index ETFs continued yesterday’s momentum to close higher with all eyes feasted on tomorrow’s conclusion of the Federal Reserve’s two-day monetary policy meeting.

The Dow Jones Industrial Average closed 138 points (0.9%) higher at 15,318, the Standard & Poor’s 500 Index rose 13 points (0.8%) to 1,652, and the Nasdaq Composite added 30 points (0.9%) to 3,482.

All ten sectors ended with solid gains, but today’s rally was predicated on the strength of cyclical names. The industrial space rose 1.3% amid outperformance in transportation and defensive stocks. Dow component General Electric settled higher by 2.4% after forging a strategic partnership with Accenture. Discretionary stocks also made a significant contribution to today’s rally as the sector displayed broad strength.

Read More

Bulls Open The Week Thanks To Positive Data

Ulli Market Commentary Contact

Mon pic

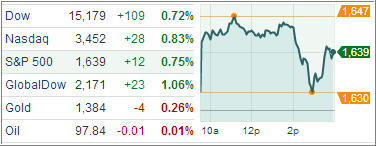
[Chart courtesy of MarketWatch.com]

Buyers came into the market today as the bulls maintain the Fed still has lingering concerns about the economy and won’t say anything to rattle the market when its two-day meeting concludes on Wednesday.

However, stocks were rattled by a Financial Times story suggesting that Fed Chairman Bernanke is likely to signal the Fed is close to tapering down its $85 billion-a-month in bond purchases. The Dow Jones Industrial Average closed 110 points (0.7%) higher at 15,180, the Standard & Poor’s 500 Index rose 12 points (0.8%) to 1,639, and the Nasdaq Composite added 29 points (0.8%) to 3,452.

Although the story did not contain any new revelations, the mere mention of tapering knocked equities off their highs. Today’s paring accelerated after a British official said the Group of Eight leaders (G-8) see downside risks to the global economy abating even as growth prospects remain weak.

Read More

ETFs/Mutual Funds On The Cutline – Updated Through 6/14/2013

Ulli ETFs on the Cutline Contact

Below are the latest ETF Cutline reports, which show how far above or below their respective long-term trend lines (39 week SMA) my currently tracked ETFs/MFs are positioned.

The first report covers the ETF Master List from Thursday’s StatSheet and includes 398 ETFs, of which currently 39 (last week 313) of them are hovering in bullish territory.

The second report includes only High Volume ETFs. To clarify, High Volume (HV) ETFs are defined as those with an average daily volume of $10 million or higher.

These ETFs are generated from my selected list of some 93 that I use in my advisor practice. It cuts out the “noise,” which simply means it eliminates those ETFs that I would never buy because of their volume limitations. 56 ETFs (last week 57) have managed to remain in bullish territory after the recent market volatility.

The third report covers Mutual Funds on the Cutline. There are currently 795 (last week 804) above the line and 64 below it out of the 859 that I follow.

Take a look:

1. ETF Master Cutline Report

2. ETF High Volume Cutline Report

3. MF Cutline Report

In case you are not familiar with some of the terminology used in the reports, please read the Glossary of Terms.

Last Week In Review: ETF News And Blog Posts To 6/16/2013

Ulli Market Review Contact

In case you missed it, here’s a summary of the ETF topics and market commentaries I posted to my blog during the week ending on 6/16/2013.

The prior week’s roller coaster ride continued as the major market indexes meandered in a range without clear direction. The S&P 500 gave back about 1% as fear of the Fed reducing its monthly bond purchases of $85 billion remains alive and well.

It seems as though we’ve been bouncing off a glass ceiling unable to break through. Until there is clear evidence as to when/if the Fed starts its tapering process, the markets may continue trading sideways until, eventually, a breakout will occur. Too much uncertainty will likely bring the downside into play with a major support level being the S&P’s 50-day moving average, which currently hovers around the 1,600 level.

Over past week, we covered the following:

Read More