One Man’s Opinion: Why Has The US Economic Recovery Been So Choppy?

Ulli Market Commentary Contact

92835431The latest inflation number has been quite low at an annual pace of 1.2 percent, but it’s a lagging indicator and will probably keep the Fed on hold for longer, meaning bond proxies and income orientation that has worked well thus far will continue to do so in future, said David Rosenberg, chief economist and strategist at Gluskin Sheff & Associates.

The Fed will probably continue with very low interest rates at least over the course of the next several months, but the reality is that the economy remains very soft considering everything that we have going for us, he noted. Suddenly, all the expectations for a three percent plus growth become 2 ½ percent. It’s fascinating to observe that if China grows three-tenths below consensus at 7.7 percent, headlines scream its economy is falling apart. But if the US misses the target by half-a-point, (people say) “don’t worry, we’re still expanding,” David quipped.

Read More

New ETFs On The Block: ishares Defined Maturity Corporate Bond ETFs

Ulli Bond ETFs Contact

139868600iShares, the world’s largest manager of exchanged traded funds and a business arm of New York-based BlackRock Inc, recently launched four iShareBonds Corporate ex-Financials Term ETFs. The new products are designed to offer you bond-like features such as a range of defined maturities while offering the benefits of ETF diversification and liquidity.

The ETFs provide you access to a diversified pool of non-financial, investment-grade and US dollar denominated corporate credit from both US and non-US issuers with at least in $250 million in outstanding face value and maturing in 2016, 2018, 2020 and 2023, respectively.

You may find the strategy interesting as are institutional clients, particularly commercial banks and private investors who are building a portfolio for retirement. The ETFs track the Barclays US Corporate Index with maturity dates between 2016 and 2023. I have highlighted the features of the funds below.

Read More

04-26-2013

Ulli Newsletter Archives Contact

ETF/No Load Fund Tracker Newsletter For Friday, April 26, 2013

ETF/No Load Fund Tracker StatSheet

————————————————————-

THE LINK TO OUR CURRENT ETF/MUTUAL FUND STATSHEET IS:

https://theetfbully.com/2013/04/weekly-statsheet-for-the-etfno-load-fund-tracker-newsletter-updated-through-04252013/

————————————————————

Market Commentary

Friday, April 26, 2013

UNINSPIRING GDP GROWTH DRAGS DOWN THE BULL

The major averages entered the weekend on a mixed note following a lackluster result on 1Q US GDP growth and a slew of below average earnings releases. The Standard & Poor’s 500 Index ended its winning streak today slipped 3 points (0.2%) to 1,582. The Nasdaq Composite dropped 11 points (0.3%) to 3,279. The Dow Jones Industrial Average in the other hand closed higher by 13 points at 14,713 thanks to Chevron and Boeing. Volume dropped off sharply on both major exchanges in the stock market today compared to Thursday’s pace.

Real GDP rose at a 2.5% annual rate in Q1, below the consensus estimate of 3.2%. The increase was driven by strong personal consumption expenditures (PCE) and inventory rebuilding, but was weighed down by negative net exports, reduced government spending, and a sharp deceleration in nonresidential fixed investment. Housing construction continues to strengthen and is expected to continue to contribute to GDP growth in the coming quarters.

Imports rebounded at a 5.4% annual rate, the most since Q3 2010, while exports rose 2.9%. As a result, net trade subtracted 0.50 percentage points from growth. The government sector fell at a 4.1% annual rate, subtracting 0.80 percentage points from growth. With the sequester taking impact in March, the drag is expected to increase going forward.

Additionally, according to Bloomberg, the gain in consumer spending is viewed as unsustainable, as disposable income adjusted for inflation fell at a 5.3% annualized rate in Q1. With consumer spending accounting for roughly 70% of GDP, this figure really raises concerns. Following the GDP release, treasuries appreciated despite the upward revision to domestic consumer sentiment.

In earnings news, Amazon.com and Dow member Chevron Corp posted mixed 1Q results and Starbucks matched analysts’ expectations, while the housing recovery lifted profits at homebuilder D.R. Horton.

Of the 271 companies in the S&P 500 that have reported earnings to date for the first quarter, 69 percent have beaten sharply reduced analyst expectations – above the 63 percent average since 1994 and slightly over the 67 percent beat rate over the past four quarters.

For the week, the Dow gained 1.1 percent, the S&P 500 added 1.7 percent and the Nasdaq rose 2.3 percent. Another week with mixed economic results – disappointing existing homes sales were met with stronger-than-expected new home sales, jobless claims fell more than expected while durable goods orders missed forecasts.

However, stocks managed to end higher thanks to the never ending fact that bad news is good news, as it assures continued money printing by the Fed even as fiscal policy continues to weigh on businesses. Economic growth in Q2 is expected to suffer due to fiscal tightening, before hopefully regaining traction later this year. How will the market be affected? Since we don’t know how things will play out, we will follow the major trends as represented by my Trend Tracking Indexes (TTIs).

Both rallied sharply this week, which means the bull is alive and well.

Here’s how we closed these out the last five trading days:

Domestic TTI: +3.52% (last week +2.80%)

International TTI: +7.35% (last week +5.54%)

Have a great week.

Ulli…

————————————————————-

READER Q & A FOR THE WEEK

All Reader Q & A’s are listed at our web site!
Check it out at:

http://www.successful-investment.com/q&a.php

A note from reader Ed:

Q: Ulli: What are your thoughts on the PRPFX Fund with gold having dropped so fast??

A: Ed: I don’t own it, since it is hovering below its long-term trend line. There are far better opportunities in low volatility ETFs.

———————————————————-

WOULD YOU LIKE TO HAVE YOUR INVESTMENTS PROFESSIONALLY MANAGED?

Do you have the time to follow our investment plans yourself? If you are a busy professional who would like to have his portfolio managed using our methodology, please contact me directly or get more details at:

https://theetfbully.com/personal-investment-management/

———————————————————

Back issues of the ETF/No Load Fund Tracker are available on the web at:

https://theetfbully.com/newsletter-archives/

ETF/No Load Fund Tracker Newsletter For Friday, April 26, 2013

Ulli ETF Tracker Contact

ETF/No Load Fund Tracker StatSheet

————————————————————-

THE LINK TO OUR CURRENT ETF/MUTUAL FUND STATSHEET IS:

https://theetfbully.com/2013/04/weekly-statsheet-for-the-etfno-load-fund-tracker-newsletter-updated-through-04252013/

————————————————————

Market Commentary

Friday, April 26, 2013

UNINSPIRING GDP GROWTH DRAGS DOWN THE BULL

The major averages entered the weekend on a mixed note following a lackluster result on 1Q US GDP growth and a slew of below average earnings releases. The Standard & Poor’s 500 Index ended its winning streak today slipped 3 points (0.2%) to 1,582. The Nasdaq Composite dropped 11 points (0.3%) to 3,279. The Dow Jones Industrial Average in the other hand closed higher by 13 points at 14,713 thanks to Chevron and Boeing. Volume dropped off sharply on both major exchanges in the stock market today compared to Thursday’s pace.

Real GDP rose at a 2.5% annual rate in Q1, below the consensus estimate of 3.2%. The increase was driven by strong personal consumption expenditures (PCE) and inventory rebuilding, but was weighed down by negative net exports, reduced government spending, and a sharp deceleration in nonresidential fixed investment. Housing construction continues to strengthen and is expected to continue to contribute to GDP growth in the coming quarters.

Imports rebounded at a 5.4% annual rate, the most since Q3 2010, while exports rose 2.9%. As a result, net trade subtracted 0.50 percentage points from growth. The government sector fell at a 4.1% annual rate, subtracting 0.80 percentage points from growth. With the sequester taking impact in March, the drag is expected to increase going forward.

Read More

Weekly StatSheet For The ETF/No Load Fund Tracker Newsletter – Updated Through 04/25/2013

Ulli ETF StatSheet Contact

ETF/Mutual Fund Data updated through Thursday, April 25, 2013

Table of Content082312

If you are not familiar with some of the terminology used, please see the Glossary of Terms.


1. DOMESTIC EQUITY MUTUAL FUNDS/ETFs: BUY — since 10/25/2011

TTI

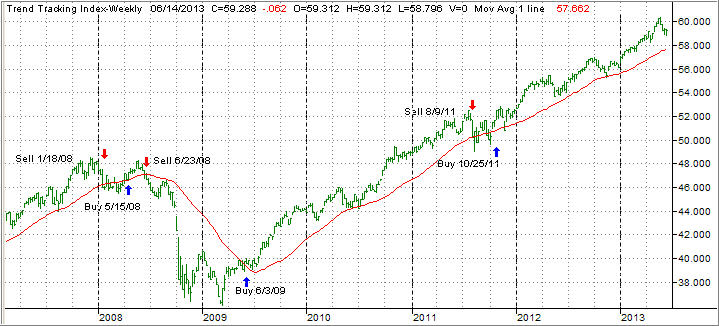
The domestic TTI broke through its long-term trend line generating a Sell for this area effective 8/9/2011. Over the recent past, we’ve seen the TTI hovering slightly below and above this dividing line between bullish and bearish territory. The clear break to the upside occurred on 10/24/11 and, effective 10/25/11, a new Buy signal for domestic equities went into effect.

As of today, our Trend Tracking Index (TTI—green line in above chart) has bounced off its long term trend line (red) by +3.77% as part of the post election rebound.

To avoid a potential whip-saw, a Sell signal to move out of all domestic equity positions will be generated once we have clearly pierced the line to the downside. Be sure to tune into my blog for the latest updates.

Read More

Positive Data Equals Another Consecutive Day of Gains

Ulli Market Commentary Contact

Thur pic

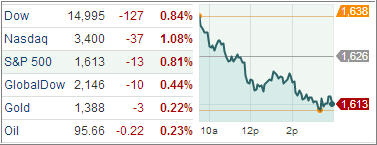
[Chart courtesy of MarketWatch.com]

The Standard & Poor’s 500 Index extended its rally to a fifth day as major U.S. equity indices closed the trading day positive. For much of Thursday, markets were boosted by a number of earnings beats and encouraging jobless numbers from the Labor Department; but gave back some gains late after reports that Germany’s central bank president announcement that he doesn’t support the ECB’s Outright Monetary Transactions program.

The day started with some good news. Initial claims for unemployment insurance fell 16,000 last week to 339,000, the second lowest level since February 2008. Economists forecasted a fall to 350,000 claims. The decline is a welcome sign the labor market is gradually improving. The level of claims remains consistent with moderate gains in payrolls. The 4-week average of claims ticked down 4,500 to 357,500, indicating a downward trend.

Continuing claims for unemployment dropped 93,000, the most since January 2012, to 3.0 million, while the insured jobless rate fell to 2.3% from 2.4%. Both were at their lowest levels since the summer of 2008.

Read More