
Negative Releases Boost Index ETFs…Again!

Ulli Market Commentary Contact

Wed pic

[Chart courtesy of MarketWatch.com]

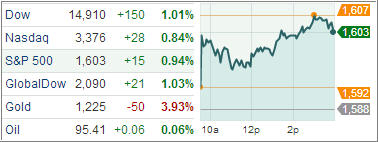
U.S. stocks rallied for a second day on Wednesday, recouping some recent losses as slower-than-forecast economic growth fueled speculation the Federal Reserve will maintain stimulus. The Dow Jones Industrial Average rose 150 points (1.0%) to 14,910, the Standard & Poor’s 500 Index added 15 points (1.0%) to 1,603, while the Nasdaq Composite gained 28 points (0.8%) to 3,376.

Equities began the session on an upbeat note despite today’s disappointing economic news, which indicated first quarter real GDP growth was revised sharply lower to a 1.8% annual rate from 2.4% in the previous estimates, below the consensus for an unchanged reading. The large decline in today’s report caught all economists by surprise.

The biggest contributors to the downward revision were real personal consumption expenditures (PCE) and nonresidential structures. PCE was revised down to a 2.6% annual rate from 3.4% in the previous estimate, reducing its contribution to GDP growth to 1.83 percentage points from 2.40. It was still the fastest PCE growth in two years; however, when considering that about 70% of GDP comes from consumer spending, this does not bode well for future growth.
Read More

7 ETF Model Portfolios You Can Use – Updated through 6/25/2013

Ulli Model ETF Portfolios Contact

The prior week’s calmness gave way to severe selling with the major indexes tumbling from their lofty levels as a result of the Fed uttering the currently most feared words in the English language, namely “tapering.” This, of course, refers to the potential toning down of the QE program.

Just about all asset classes got spanked with the S&P 500 losing some 3.9% since last week’s ETF Model Portfolio report. There was simply no place to hide, but it could have been a lot worse had it not been for last minute calming announcements by various Fed officials.

However, the words have been muttered, and it now depends on the “buying the dip” crowd as to whether we will enter bear market territory or bounce off these levels.

Several sell stops in our model portfolios were triggered, and the affected positions were noted as closed. Since PRPFX went into sell mode, I also closed out the #7 portfolio, which is its ETF equivalent. It’s redundant right now, as PRPFX is represented by the ETF PERM, which you can use if your preference is the ETF version.

Here’s the latest ETF Model Portfolio update:

Read More

Strong Data Set Off Market Rebound; Domestic TTI Inches Back Above The Line

Ulli Market Commentary Contact

Tue pic

[Chart courtesy of MarketWatch.com]

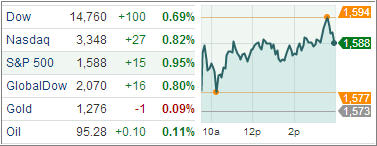
Bulls got some much needed fuel to push U.S. equity markets higher, the most in nearly two weeks thanks to a slew of upbeat domestic economic reports. The Dow Jones Industrial Average rose 101 points (0.7%) to 14,760; the Standard & Poor’s 500 Index rebounded from a nine-week low, added 15 points (1.0%) to 1,588, while the Nasdaq Composite gained 27 points (0.8%) to 3,348.

U.S. stocks climbed today as the Conference Board’s index of U.S. consumer confidence rose 7.1 points in June, its third straight gain, to 81.4, the highest level since January 2008 . Economists expected the index would decline 0.7 points to 75.5.

Consumers remain upbeat despite higher payroll and income taxes this year and the negative impact from the government sequester. The current confidence level is allegedly consistent with the trend in economic growth. Elsewhere, new home sales rose 2.1% to a 476,000 unit annual rate, the highest level since July 2008. Economists expected a 1.8% gain to a 462,000 unit rate. On a y/y basis, sales are up 29.0%. With sharply rising mortgage rates, I have to wonder how long that will last.

Read More

Chinese Stocks Enter Bear Market Territory; Domestic TTI Follows Suit; Is The S&P 500 Next?

Ulli Market Commentary Contact

Mon pic

[Chart courtesy of MarketWatch.com]

Equity and bond index ETFs were battered and beaten on Monday, sending the Standard & Poor’s 500 Index to a nine-week low and adding to last week’s move downward. The focal points on those fronts were the 10-yr note yield, which spiked to 2.66% in early action, and the uncertainty surrounding what impact the Federal Reserve’s potential tapering will have on the economy was exacerbated by festering liquidity fears in China.

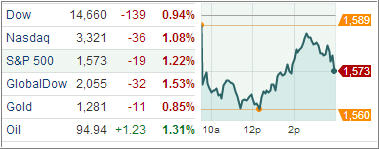
The Dow Jones Industrial Average dropped more than 240 points (or 2%) in early trading, fought back to a loss of nearly 60 points by midday, before tripping up and finishing down 139 points (0.9%). The Standard & Poor’s Index 500 lost 19 points (1.2%) to 1,573, while the Nasdaq Composite declined 36 points (1.1%) to 3,321.

The initial plunge in U.S. markets appeared to be precipitated by China. Chinese equities entered a bear market as the CSI 300 Index of China’s biggest companies tumbled 6.3 percent, the most since August 2009 as depicted by a 20% pullback from recent highs, as banking stocks in China came under heavy pressure. The People’s Bank of China was behind this sell-off but refused to inject liquidity into its banking system. It issued a statement today saying lenders should not expect it to help stem a perceived credit crunch.

Read More

ETFs/Mutual Funds On The Cutline – Updated Through 6/21/2013

Ulli ETFs on the Cutline Contact

Below are the latest ETF Cutline reports, which show how far above or below their respective long-term trend lines (39 week SMA) my currently tracked ETFs/MFs are positioned.

The first report covers the ETF Master List from Thursday’s StatSheet and includes 398 ETFs, of which currently 263 (last week 313) are hovering in bullish territory.

The second report includes only High Volume ETFs. To clarify, High Volume (HV) ETFs are defined as those with an average daily volume of $10 million or higher.

These ETFs are generated from my selected list of some 93 that I use in my advisor practice. It cuts out the “noise,” which simply means it eliminates those ETFs that I would never buy because of their volume limitations. 45 ETFs (last week 56) have managed to remain in bullish territory after the recent market volatility.

The third report covers Mutual Funds on the Cutline. There are currently 722 (last week 795) above the line and 137 below it out of the 859 that I follow.

Take a look:

1. ETF Master Cutline Report

2. ETF High Volume Cutline Report

3. MF Cutline Report

In case you are not familiar with some of the terminology used in the reports, please read the Glossary of Terms.

Last Week In Review: ETF News And Blog Posts To 6/23/2013

Ulli Market Review Contact

In case you missed it, here’s a summary of the ETF topics and market commentaries I posted to my blog during the week ending on 6/23/2013.

The bulls started the past week with a bang only to see the bears move in, take over and dish out a severe spanking.

The S&P 500 gave back more than 2%, while world markets in general hit the skids with our Domestic Trend Tracking Index (TTI) moving dangerously close to slipping into bear market territory. Again, as I have repeatedly pounded on, be sure to have your exit strategy in place and execute it as your sell stops tell you to do so.

With today being the 5-year anniversary of our last major sell signal (6/23/08), and our TTIs heading south, it is advisable for you to prepare your portfolio for evasive action. With the Fed’s policies having been the only driver for equity markets, you never know when this bull market will end; maybe it already has.

Over past week, we covered the following:

Read More