 The ETF/No Load Fund Tracker
Monthly Review—June 30, 2013
Fed Taper-Talk Weighs On US Equities In June; Europe Slips On Growth Concerns
US stocks finished June with losses, but managed to post gains for the quarter as investors started to scrutinize stock prices in an environment where a dialing back of asset purchases by the Federal Reserve by the end of the year was being seriously debated.
The latest FOMC statement and subsequent comments from Ben Bernanke sent equities and Treasuries to their lows while boosting the dollar in the latter half of the month. Chairman Bernanke said the Fed could reduce the pace of asset purchases later this year and stop expanding the central bank’s balance sheet entirely by the middle of next year if conditions continued to improve.
The Dow Jones Industrial Average (DJIA) finished June at 14,909.60, down 1.5 percent for the month, but up 2.3 percent for the quarter.
The Dow added 13.8 percent in the first six months of the year, marking its best first half of a year performance since 1999.
The S&P 500 (SPX) ended June 1.5 percent lower at 1,606.28, but picked up 2.4 percent for the quarter.
The tech-heavy NASDAQ Composite index (COMP) closed June at 3403.25, down 1.5 percent for the month, but higher 4.2 percent for the quarter.
Economic news from the US continued to be mixed in June though investor sentiment seems to be very much linked to the perceived longevity of the Fed’s monetary stimulus program, as a downward revision of the first-quarter gross domestic product triggered a rally in the equity markets. This is also known as bad news is good news. The final iteration of first-quarter GDP was revised down to 1.8 percent from 2.4 percent with services-spending contributing the most in the unusual decline.
Consumer opinion held its ground with the June consumer sentiment index final reading coming in at 84.1, beating forecasts for 83, but slightly down from May’s reading of 84.5.
Also, data released by Automatic Data Processing Inc showed US employers added 188,000 private jobs in June, beating street-estimates. First-time jobless claims came in better than expected, dipping by 5,000 to 343,000 in the final week of June, the Labor Department said.
Investor sentiment got a further boost after a report showed pending home sales for May rose 6.7 percent, beating economists projection for a 1.5 percent increase.
On the flip side, the US trade deficit jumped 12.1 percent in May to $45.0 billion as imports rose and exported inched lower, a Commerce Department report revealed.
Also, the services sector growth slowed down in June with the non-manufacturing gauge slipping to 52.2 percent from 53.7 percent in May. Readings above 50 percent signal expansion with higher rates indicating faster growth. Economists had forecast a reading of 54.2 percent.
The International Monetary Fund lowered US growth forecast to 2.7 percent from 3 percent in 2014. The Fed must carry on large-scale assets purchase at least until the year-end to sustain growth, it added.
Across the Atlantic, European stocks finished the month and the quarter down, dragged lower by concerns over US interest-rate policy and growth in emerging markets even as European economies showed some signs of improvement.
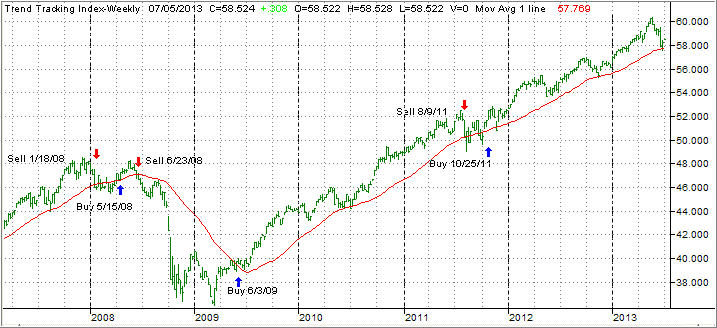
In regards to long-term trends, things started to look a little shaky after the Fed’s tapering announcement. Our main directional gauge, the Domestic Trend Tracking Index (TTI), headed south and briefly dipped into bear market territory on June 24th. The ensuing rally prevented us from executing the sell signal. Here’s what the Domestic TTI looks like with the red arrow pointing to the dip below the trend line:

While that sell signal was temporarily avoided, weakness in other areas persisted and several sell stops were triggered. The Vanguard REIT Index (VNQ) headed sharply south early on in June and was sold.
Our holdings in the low volatility index (SPLV) followed suit and was liquidated as well. Two things were unusual during the June sell off:
1. Low volatility ETFs, such as XLP and SPLV, behaved like high volatility funds, and fluctuated with greater magnitude than the benchmark S&P 500 index.
2. The benefit of a diversified portfolio into equities and bonds did not hold up as bonds declined right along with equities, a result of rising interest rates, which pushed mortgage rates up by an incredible 1.5% within a couple of weeks.
In the end, the place to be was 100% in equities as they held up better due to support by Fed policy. We also ended up liquidating the PIMCO Income Fund (PONDX) as it not only triggered its trailing sell stop but also pierced its respective trend line to the downside.
This leaves us with an invested position of about 50% which, given the accelerating uncertainties, is not a bad place. Some of our holdings are within 2.5% of triggering their respective sell stops, so it won’t take much of a downturn to get us out of the market.
Earnings season is upon us, and the ever lengthening menu of various hot spots around the world could very easily put the bears in charge. I will execute our stops when necessary to protect our portfolios from undue downside risk.

 Emerging Global Advisors, the NY-based specialist ETF issuer known for its suite of emerging markets funds, has announced the launch of the EGShares Emerging Markets Dividend Growth ETF (EMDG), the second dividend fund after the EGShares Low Volatility Emerging Markets Dividend ETF (HILO). The ETF, unveiled on Monday and listed on the NYSE Arca, gives investors exposure to developing market companies that are maturing and focusing more on raising dividends.