Another record day as the Dow and the S&P 500 closed at new all-time highs. Markets got a leg up due to stronger-than-expected earnings and guidance from Dow member Home Depot, and further amplified by comments from two Federal Reserve officials that suggested that the Central Bank hasn’t yet set a course to taper its bond-buying initiatives.
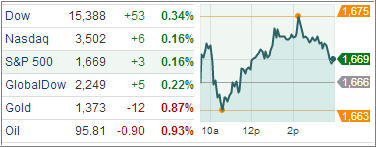
The Dow Jones Industrial Average rose 53 points (0.3%) to 15,388 to register its 19th consecutive Tuesday of gains, the S&P 500 Index gained 3 points (0.2%) to 1,669, and the Nasdaq Composite added 6 points (0.2%) to 3,502.
The major averages saw little change during morning action, but afternoon buying interest helped lift the indices to session highs. Most cyclical sectors (with the exception of materials and technology) finished among the leaders, but the defensively-geared health care sector settled atop the leader board as biotechnology outperformed. The iShares Nasdaq Biotechnology ETF advanced 1.0%, and prevented the Nasdaq from falling too far behind the other two indices as technology displayed relative weakness.