ETF/No Load Fund Tracker Newsletter For Friday, May 24, 2013
ETF/No Load Fund Tracker StatSheet
————————————————————-
THE LINK TO OUR CURRENT ETF/MUTUAL FUND STATSHEET IS:
————————————————————
Market Commentary
Friday, May 24, 2013
BEARS PASS BULLS HEADING INTO THE WEEKEND
A quiet, low-volume session Friday drifted to a mixed close with the three major stock indexes posting their first negative week since mid-April on lingering concern that the central bank may scale back its stimulus measures to support the economy.
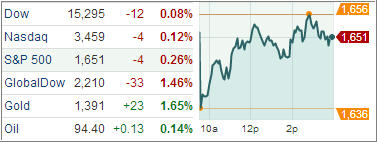
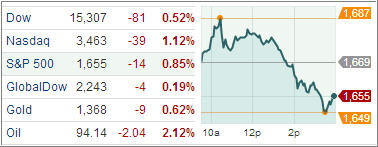
The Dow Jones Industrial Average closed marginally higher by 9 points (0.1%) at 15,303, while the Standard & Poor’s 500 Index and the Nasdaq Composite descended 1 point to close at 1,650 and 3,499, respectively. Both lost ground for a third-straight day, a first in 2013 for the two indexes. In light volume, 591 million shares were traded on the NYSE, and 1.4 billion shares changed hands on the Nasdaq.
The major averages began the day on a lower note as nine of ten sectors saw losses of more than 0.5%. The consumer staples sector (XLP) was the lone exception as the group spent the entire day in positive territory thanks to the relative strength of Dow component Procter & Gamble. The second-largest staple stock advanced 4.1% after the company reaffirmed its fourth quarter guidance and named Alan Lafley President, Chairman, and CEO. Ahead of the holiday weekend, the broader market drifted back towards yesterday’s closing levels.
The energy space lost 0.4% as crude oil shed 0.4% to end at $93.92. Industrials also pressured the broader market as transportation-related names sold off. Relative weakness in truckers, delivery services, and shippers caused the Dow Jones Transportation Average to lose 0.5%.
Cyclical groups saw comparable losses in early action. However, the financial sector displayed some afternoon strength as major banks registered gains. Today’s biggest laggards could be found in the high-yielding utilities sector as the group continued its recent weakness. Including today’s 1.0% decline, the sector lost 3.7% this week, and is down 6.7% in May.
For the week, the Dow fell 0.3 percent, while the S&P 500 and the Nasdaq each dropped 1.1 percent. The S&P 500 had traded below its 14-day moving average – 1,647.91 – during the day but closed just couple of points above the level.
Overall, the U.S. stock market’s pullbacks have been short and shallow since November as traders have taken any weakness as an opportunity to increase long positions. Stocks ended their weekly record-high streak on uneasiness surrounding the impact of the potential Fed downshifting of its asset purchases.
These concerns came courtesy of Fed’s Chief Bernanke’s testimony on Capitol Hill offering mixed signals regarding asset purchases. Following the Fed events, Japanese stocks tumbled the most since the aftermath of the March 2011 earthquake, as the Fed tightening fears were exacerbated by a report showing an unexpected contraction in Chinese manufacturing.
However, stocks managed to limit losses, led by the Dow, aided by stronger-than-forecasted earnings reports from Home Depot and Hewlett-Packard. Also, with existing home sales rising to a pace not seen since November 2009, and new home sales exceeding expectations, while jobless claims fell more than expected to compliment Friday’s durable goods report, all contributed to the damage control.
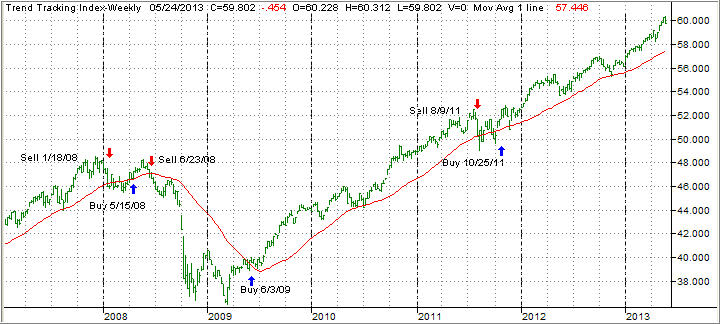
Our Trend Tracking Indexes (TTIs) joined the major indexes and came off their lofty levels ending the week as follows:
Domestic TTI: +4.08% (last week +5.07%)
International TTI: +8.29% (last week +10.09%)
We remain fully invested subject to our trailing sell stops.
Have a great week.
Ulli…
————————————————————-
READER Q & A FOR THE WEEK
All Reader Q & A’s are listed at our web site!
Check it out at:
http://www.successful-investment.com/q&a.php
A note from reader Jake:
Q: Ulli: Thanks again for the assistance you gave me during our recent phone conversation. Among other things, you mentioned that you were working on a new e-book with the thought provoking title “Beating the S&P…with the S&P.” Can you elaborate again as to when that project will be finished?
A: Jake: Yes, I indeed am working on this e-book, which will be made available for free to anyone who is interested in this topic. It covers the past 13 years and shows the many advantages of using trend tracking vs. Buy-and-Hold backed by hard evidence and many truly enlightening charts. Barring any unforeseen circumstances, I hope to have it finished by the beginning of July.
———————————————————-
WOULD YOU LIKE TO HAVE YOUR INVESTMENTS PROFESSIONALLY MANAGED?
Do you have the time to follow our investment plans yourself? If you are a busy professional who would like to have his portfolio managed using our methodology, please contact me directly or get more details at:
https://theetfbully.com/personal-investment-management/
———————————————————
Back issues of the ETF/No Load Fund Tracker are available on the web at: