08-16-2013

Ulli Newsletter Archives Contact

ETF/No Load Fund Tracker Newsletter For Friday, August 16, 2013

ETF/No Load Fund Tracker StatSheet

————————————————————-

THE LINK TO OUR CURRENT ETF/MUTUAL FUND STATSHEET IS:

https://theetfbully.com/2013/08/weekly-statsheet-for-the-etfno-load-fund-tracker-newsletter-updated-through-08152013/

————————————————————

Market Commentary

Friday, August 16, 2013

Treasury Yields Surge While Stocks Continue To Head South

U.S. equity markets extended their recent decline into the final hour of trading, in which stocks attempted to erase most of their losses before ultimately closing the session to the downside, as Fed tapering concerns continue to leave investors cautious.

Meanwhile, ten-year treasury yields surge to two-year highs. The DJIA posted its biggest weekly loss this year as rising bond yields hurt shares paying rich dividends. The Dow closed 30 points lower (0.2%) at 15,082, the S&P 500 Index dropped 5 points (0.3%) to 1,656, and the Nasdaq Composite lost 3 points to 3,603.

There was evidence in today’s session of pressing the buy-the-dip trade that was seen early on in the outperformance of the homebuilding stocks, which have been hit hard of late.  Ultimately, the strength in homebuilding stocks faded as the yield on the 10-yr note, and concerns about rising mortgage rates, increased. The on again-off again showing of the homebuilders was representative of the overall action.  There just wasn’t a lot of conviction on either the buy side or the sell side.

Gains in individual stocks like Boeing, Apple, American Express, and United Continental offered a measure of support, but clear-cut sector strength was lacking for the most part today.  Retailers were once again on the soft side after couple big names like Nordstrom and Jos. A. Bank joined the roster of retail companies providing earnings warnings.

The continued rise in long-term rates continued to take a toll on the high-dividend yielding utilities (-1.1%) and telecom services (-1.0%) sectors, which were the only sectors to lose at least 1.0% today.  For the week, the utilities sector dropped 4.4% while the telecom services sector fell 2.3%.

In economics news, housing starts for July came in slightly below expectations, rising 5.9% month-over-month to an annual pace of 896,000 units. Economists called for starts to come in at 900,000 units. Preliminary 2Q nonfarm productivity rose 0.9% on an annualized basis, from the 0.5% increase seen in the 1Q, and compared to the 0.6% gain that was expected. Rounding out a busy week on the economic front, the preliminary University of Michigan Consumer Sentiment Index surprisingly deteriorated, declining to 80.0 in August, from 85.1 in July, compared to economists’ expected increase to 85.5.

It was a second week of losses for the major indexes. The Dow fell 2.2 percent for the week, its biggest decline since June 2012, while the S&P 500 and Nasdaq registered their biggest weekly losses since June, 2013. For the week, the S&P 500 was down 2.1 percent and the Nasdaq was down 1.6 percent. Investors and traders are betting on the Federal Reserve to start reducing its bond purchases next month, which are ultimately hurting U.S. stocks and bonds alike.

Our Trend Tracking Indexes (TTIs) followed the weakness in the markets and closed this volatile week as follows:

Domestic TTI: +1.67% (last week +3.30%)

International TTI: +5.86% (last week +6.85%)

Have a great week.

Ulli…

————————————————————-

READER Q & A FOR THE WEEK

All Reader Q & A’s are listed at our web site!
Check it out at:

http://www.successful-investment.com/q&a.php

A note from reader Mo:

Q: Ulli: Thanks as always for your work. Hey, did you watch “60 Minutes” on CBS last night, articles about China and its building boom. It was like a sci-fi movie seeing all those brand new high-rise cities, new highways, new malls (with fake brand name signs), etc., all vacant. They talked strongly about a “realty bubble”. If you missed the show, definitely, see it. When the China bubble does break, do you suspect a time to invest in special areas, or a time to go to “cash?”

A: Mo: Investing in special areas is always a possibility, however, the first move after a bubble bursts and/or a sell signal has been generated, is to cash/money market.

Then you can then calmly evaluate whether there are other opportunities. In the past, bonds have been the safe play once equities head into bear market territory, but with interest rates coming off all-time lows, this may not be the case next time. We have to wait and see what other opportunities will present themselves when the time comes.

———————————————————-

WOULD YOU LIKE TO HAVE YOUR INVESTMENTS PROFESSIONALLY MANAGED?

Do you have the time to follow our investment plans yourself? If you are a busy professional who would like to have his portfolio managed using our methodology, please contact me directly or get more details at:

https://theetfbully.com/personal-investment-management/

———————————————————

Back issues of the ETF/No Load Fund Tracker are available on the web at:
https://theetfbully.com/newsletter-archives/

ETF/No Load Fund Tracker Newsletter For Friday, August 16, 2013

Ulli ETF Tracker Contact

ETF/No Load Fund Tracker StatSheet

————————————————————-

THE LINK TO OUR CURRENT ETF/MUTUAL FUND STATSHEET IS:

https://theetfbully.com/2013/08/weekly-statsheet-for-the-etfno-load-fund-tracker-newsletter-updated-through-08152013/

————————————————————

Market Commentary

Friday, August 16, 2013

Treasury Yields Surge While Stocks Continue To Head South

U.S. equity markets extended their recent decline into the final hour of trading, in which stocks attempted to erase most of their losses before ultimately closing the session to the downside, as Fed tapering concerns continue to leave investors cautious.

Meanwhile, ten-year treasury yields surge to two-year highs. The DJIA posted its biggest weekly loss this year as rising bond yields hurt shares paying rich dividends. The Dow closed 30 points lower (0.2%) at 15,082, the S&P 500 Index dropped 5 points (0.3%) to 1,656, and the Nasdaq Composite lost 3 points to 3,603.

There was evidence in today’s session of pressing the buy-the-dip trade that was seen early on in the outperformance of the homebuilding stocks, which have been hit hard of late.  Ultimately, the strength in homebuilding stocks faded as the yield on the 10-yr note, and concerns about rising mortgage rates, increased. The on again-off again showing of the homebuilders was representative of the overall action.  There just wasn’t a lot of conviction on either the buy side or the sell side.

Read More

Weekly StatSheet For The ETF/No Load Fund Tracker Newsletter – Updated Through 08/15/2013

Ulli ETF StatSheet Contact

ETF/Mutual Fund Data updated through Thursday, August 15, 2013

Table of Content082312

If you are not familiar with some of the terminology used, please see the Glossary of Terms.


1. DOMESTIC EQUITY MUTUAL FUNDS/ETFs: BUY — since 10/25/2011

TTI

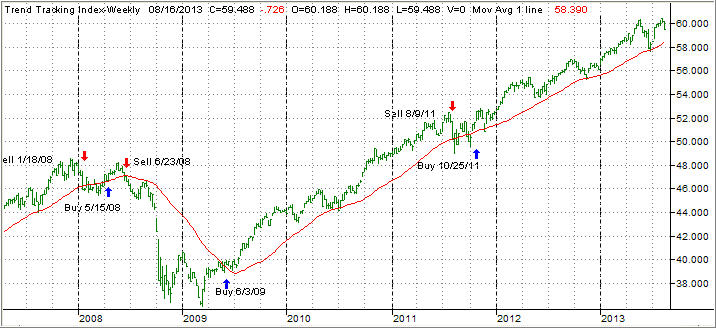
The Domestic TTI broke through its long-term trend line generating a Sell for this area effective 8/9/2011. Over the recent past, we’ve seen the TTI hovering slightly below and above this dividing line between bullish and bearish territory. The clear break to the upside occurred on 10/24/11 and, effective 10/25/11, a new Buy signal for domestic equities went into effect.

As of today, our Trend Tracking Index (TTI—green line in above chart) has bounced off its long term trend line (red) by +2.06% after briefly dipping below it late in June.

To avoid a potential whip-saw, a Sell signal to move out of all domestic equity positions will be generated once we have clearly pierced the line to the downside. Be sure to tune in for the latest updates.

Read More

Index ETFs See Red On Continued Fed Fear

Ulli Market Commentary Contact

Thur pic

[Chart courtesy of MarketWatch.com]

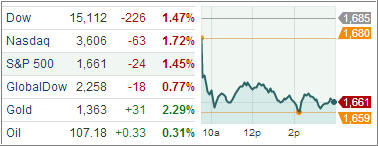
The U.S. equity markets extended yesterday’s selloff to close decisively lower, the most since June as forecasts from Cisco Systems Inc. and Wal-Mart Stores Inc. disappointed while a large dose of mixed domestic data added to investor worries that the Federal Reserve may begin tapering in the near future.

About 6.6 billion shares exchanged hands on U.S. exchanges today, 4.5 percent above the three-month average, while The CBOE Volatility index rose nearly 12 percent. Treasury yields rose to the highest levels in two years.

All 10 major industries in the S&P 500 retreated, with seven of ten groups posting losses larger than 1.0% while, energy (-0.7%), materials (-0.8%), and telecom services (-0.9%) outperformed. Technology and consumer-discretionary shares dropped more than 1.7 percent after Wal-Mart’s shares fell on a surprise decline in quarterly same-store sales and Cisco Systems shares slipped one day after the network equipment maker announced it was cutting 4,000 jobs.

Read More

Fed Tapering Haunts Markets Again

Ulli Market Commentary Contact

Wed pic

[Chart courtesy of MarketWatch.com]

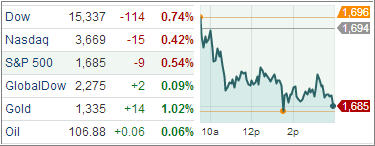
Domestic equity markets continued the recent downward trend with trading volumes about 22 percent below the 100-day average. Earnings season is winding down and economic indicators present a mixed view, complicating predictions of the Fed’s next policy action.

Mixed economic data has led to heightened anxiety that the Federal Reserve may begin to taper its asset purchase program this year, possibly as early as September. Equities were confined to a downtrend from the open, and even the news of the first expansionary Eurozone GDP reading in 18 months could not spark a bid.

Nine of ten sectors registered losses while technology posted a fractional gain of 0.01%. The tech sector climbed into the lead early this afternoon. The relative strength of the largest sector component overshadowed the underperformance of chipmakers. While technology was able to end in the green, the materials sector shed 0.2% after spending the majority of the session in positive territory.

Read More

7 ETF Model Portfolios You Can Use – Updated through 8/13/2013

Ulli Model ETF Portfolios Contact

After conquering the 1,700 marker for the S&P 500, we slipped again below it and meandered aimlessly for most of the week. The S&P 500 gave back 3 points since last week’s portfolio report.

This sideways pattern does not surprise me as earnings season has come to an end and recent economic reports have not been overpowering in content, so a new driver is needed to push the index back above the 1,700 level.

Taper talk has been mainly neutral and, absent any major news event, we may very well spend the last couple weeks of summer drifting within a narrow range.

Here’s the latest ETF Model Portfolio update:

Read More