Losing Streak Comes To A Halt

Ulli Market Commentary Contact

Thur pic

[Chart courtesy of MarketWatch.com]

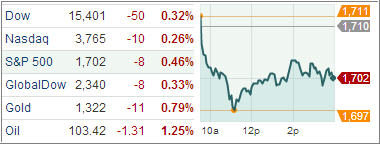
U.S. equities closed the trading day higher, halting the longest slump this year for the Standard & Poor’s 500 Index, as investors welcomed a better-than-expected jobless report, which overshadowed concern that a budget impasse could hurt economic growth.

Meanwhile, Treasuries were mostly lower following the upbeat employment data, which was accompanied by an unrevised 2.5% rate of 2Q GDP growth, which neutralized disappointing pending home sales and regional manufacturing reports. The Dow and S&P 500 rose after five straight sessions of losses, while the Nasdaq closed just shy of a high last seen about 13 years ago.

Washington continues to attempt a timely resolution to U.S. fiscal issues as House Republicans refused to give in to President Barack Obama’s demands for straightforward bills to keep the government running beyond September 30 and to increase borrowing authority to avoid a historic default. Congress, struggling to avert a government shutdown next week, was warned by the Obama administration that the Treasury was quickly running out of funds to pay government bills and could soon face a damaging debt default.
Read More

Major Index ETFs Slip And Slide As Spending Battle Begins

Ulli Uncategorized Contact

Wed pic

[Chart courtesy of MarketWatch.com]

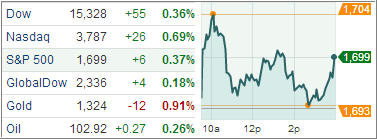
Domestic equity markets fell today and the S&P 500 put in a fifth day of losses, its longest losing streak since the end of 2012, following some diverging domestic economic reports. Including today’s decline, the benchmark index has surrendered 1.9% since last Thursday.

Treasuries were higher amid the U.S. fiscal uncertainty and after durable goods orders came in mixed, offsetting a slightly higher rate of new home sales and a solid increase in mortgage applications. Investors worried about two looming Washington deadlines: prior to October 1 Congress needs to pass stop-gap funding for federal agencies and by October 17 it must raise the federal borrowing limit to avoid a debt default by the United States.

After opening just above its flat line, the S&P 500 slipped into the red before recovering swiftly with the help of energy (-0.1%) and materials (+0.2%). The financial sector (+0.5%) also fueled this morning’s rebound after losing roughly 3.5% during the past four sessions. The morning recovery placed the S&P above 1,700, but the index could not muster additional strength as consumer staples (-0.8%), health care (-0.8%), technology (-0.3%), and utilities (-0.7%) weighed.

Read More

7 ETF Model Portfolios You Can Use – Updated through 9/24/2013

Ulli Model ETF Portfolios Contact

After making new highs last week, following the Fed’s surprising “non-taper” announcement, the major indexes slipped with the S&P 500 dropping slightly below its 1,700 level and giving back some 0.5% since last week’s Model portfolio report.

It’s amazing to me that the Fed blinked after the markets had for weeks priced in a modest amount of taper, probably in the area of $10 billion per month, which may not have pulled the indexes off their lofty levels as expectations simply would have been met.

Not tapering at all has caused confusion in the markets and simply constitutes an admission by the Fed that the economy is in far worse shape as had been assumed. With several years of Quantitative Easing (QE) now in the rear view mirror, and trillions of dollars spent, it has become clear that nothing has been accomplished in regards to organic economic growth. Makes me wonder whether the Fed will ever be able to stop their endless QE efforts…

Most likely, at some point in the future the market will force the hand.

In the meantime, here’s the latest ETF Model Portfolio update:

Read More

Congress Battles Heat Up; Turning Stocks Red

Ulli Market Commentary Contact

Tue chart

[Chart courtesy of MarketWatch.com]

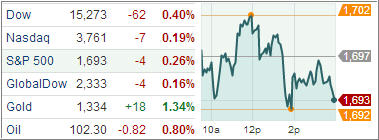
U.S. equities concluded a lackluster day of trading hovering near the flatline during the final hour of the session, before ultimately ended lower, extending their recent slide to a fourth session as worries over a possible U.S. government shutdown added to investor caution.

The market’s recent losses mark the longest losing streak since last month for the S&P 500, which has been down every session since rallying 1.2 percent last Wednesday on the Fed announcement. Meanwhile, Treasuries were mostly higher, despite a report that showed housing prices gained ground again in July, while separate releases for September showed consumer sentiment declined more than expected.

Though uncertainty remains over the Federal Reserve’s intentions to scale back its stimulus since the central bank’s decision last week to leave its current program unchanged, some of the focus for now has turned to Capitol Hill. Stocks slipped during the opening hour in reaction to a below-consensus consumer confidence report for September. Gains in the stock market were unable to thwart pessimism in the labor market as the September Consumer Confidence Index fell to 79.7 from an upwardly revised 81.8 (from 81.4) in August. Economists expected the Index to drop to 80.0. Despite the opening slip, the S&P recovered swiftly, but was unable to hold the 1,700 level into the close as financials and technology weighed.

Read More

Confusion Continues Thanks To Fed And Congress

Ulli Market Commentary Contact

Mon pic

[Chart courtesy of MarketWatch.com]

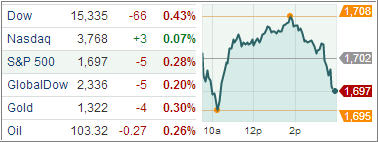
U.S. equity indexes declined for a third straight session today amid the continued uncertainty surrounding the Federal Reserve’s timing over tapering and the U.S. fiscal fight brewing in Washington.

Meanwhile, treasuries ended higher following a preliminary report that showed growth in U.S. manufacturing activity unexpectedly decelerated. Technology stocks, however, found some support from Apple’s announcement of its weekend-record-sales of the new iPhones, while Blackberry Limited entered into a letter of intent agreement with a consortium lead by Fairfax Financial Holdings Limited to acquire the smartphone maker in a transaction worth roughly $4.7 billion.

The preliminary Markit US Manufacturing PMI Index declined to 52.8 in September, from 53.1 in August, compared to the improvement to 54.0 that economists had expected. The report showed although output grew at a faster rate, expansion in new orders slowed, while new export orders fell back below 50 and inventories remained in contraction territory. This was the second-straight monthly decline, but a reading above 50 denotes expansion in manufacturing activity, the economy is showing signs of alleged stealthy acceleration.

Read More

ETFs/Mutual Funds On The Cutline – Updated Through 9/20/2013

Ulli ETFs on the Cutline Contact

Below are the latest ETF Cutline reports, which show how far above or below their respective long-term trend lines (39 week SMA) my currently tracked ETFs/MFs are positioned.

The first report covers the ETF Master List from Thursday’s StatSheet and includes 398 ETFs, of which currently 322 (last week 310) are hovering in bullish territory.

The second report includes only High Volume ETFs. To clarify, High Volume (HV) ETFs are defined as those with an average daily volume of $10 million or higher.

These ETFs are generated from my selected list of some 93 that I use in my advisor practice. It cuts out the “noise,” which simply means it eliminates those ETFs that I would never buy because of their volume limitations. 67 ETFs (last week 63) have managed to remain in bullish territory after the recent market volatility.

The third report covers Mutual Funds on the Cutline. There are currently 800 (last week 784) above the line and 59 below it out of the 859 that I follow.

Take a look:

1. ETF Master Cutline Report   

2. ETF High Volume Cutline Report

3. MF Cutline Report

In case you are not familiar with some of the terminology used in the reports, please read the Glossary of Terms.

If you missed the original post about the Cutline approach, you can read it here.