ETFs/Mutual Funds On The Cutline – Updated Through 7/26/2013

Ulli ETFs on the Cutline Contact

Below are the latest ETF Cutline reports, which show how far above or below their respective long-term trend lines (39 week SMA) my currently tracked ETFs/MFs are positioned.

The first report covers the ETF Master List from Thursday’s StatSheet and includes 398 ETFs, of which currently 307 (last week 309) are hovering in bullish territory.

The second report includes only High Volume ETFs. To clarify, High Volume (HV) ETFs are defined as those with an average daily volume of $10 million or higher.

These ETFs are generated from my selected list of some 93 that I use in my advisor practice. It cuts out the “noise,” which simply means it eliminates those ETFs that I would never buy because of their volume limitations. 58 ETFs (last week 57) have managed to remain in bullish territory after the recent market volatility.

The third report covers Mutual Funds on the Cutline. There are currently 664 (last week 803) above the line and 195 below it out of the 859 that I follow.

Take a look:

1. ETF Master Cutline Report

2. ETF High Volume Cutline Report

3. MF Cutline Report

In case you are not familiar with some of the terminology used in the reports, please read the Glossary of Terms.

One Man’s Opinion: Will Draghi Announce Any Stimulus In Next Week’s ECB Meeting?

Ulli Market Review Contact

92835431The bond yields of Spain and Italy have come down drastically and both are well below 5 percent now, a very stable level that can tide those countries over as they continue to try to raise money at reasonable rates, observed Kathleen Brooks of Forex.com.

Regarding the euro, Draghi has been incredibly clever with what he has done. They don’t like the euro falling too low, so when it was slipped close to $1.20 this time a year ago, he “talked” and that kind of helped prop up the euro. Again back in February when it was at $1.37 and was too strong for the European Central Bank, he successfully talked it down and now the euro is in a kind of equilibrium at $1.32, she noted.

Asked if she agreed with other analysts that Draghi has not been successful in reviving the credit channels and transmission mechanisms that could boost commercial and consumer lending, Kathleen said lending data out from the ECB this week showed consumer lending increased in the second quarter. But it is business lending that is mired in a depression, particularly in the periphery and that has been a big worry. Draghi can’t just use his rhetoric to improve that because that’s a structural issue and it’s going to take a long time because countries like Spain got into a debt problem and it’s going to take some time, Kathleen observed.

Read More

New ETFs On The Block: Wisdomtree Japan Hedged Smallcap And UK Hedged Equity ETFs (DXJS, DXPS)

Ulli Equity ETFs Contact

105487691WisdomTree, the New York-based fifth largest provider of exchange-traded funds (ETFs) that sponsors 51 different ETFs spanning asset classes and geographies, launched two new ETFs recently.  The WisdomTree Japan Hedged SmallCap Equity ETF (DXJS) provides exposure to small cap Japanese stocks, while the WisdomTree United Kingdom Hedged Equity ETF (DXPS) provides exposure to UK equities.

The year 2013 has been fairly rewarding for WisdomTree due to growing investor interest in the firm’s pioneering products like active ETFs and fundamentally weighted ETFs. The immensely popular Japan Hedged Equity Fund (DXJ) is a case in point; the hedged yen ETF has raked in about $7.9 billion in fresh investments as advisors and investors lapped up Japanese equities.

Both of the new funds come at a critical time for the respective currencies versus the US dollar since both the Bank of Japan and the Bank of England are likely to continue with their quantitative easing measures while the US Fed is likely to start scaling down its monetary stimulus program later this year.

Read More

07-26-2013

Ulli Newsletter Archives Contact

ETF/No Load Fund Tracker Newsletter For Friday, July 26, 2013

ETF/No Load Fund Tracker StatSheet

————————————————————-

THE LINK TO OUR CURRENT ETF/MUTUAL FUND STATSHEET IS:

https://theetfbully.com/2013/07/weekly-statsheet-for-the-etfno-load-fund-tracker-newsletter-updated-through-07252013/

————————————————————

Market Commentary

Friday, July 26, 2013

DOWN EARLY, BUT UP LATE

Despite starting the day sharply lower, the U.S. equity markets eked out gains to close the Friday session marginally higher. Stocks started the day to the downside in the wake of a 3% decline in the Japanese equity sell-off, as did a series of mixed earnings reports that featured notable misses from Amazon.com and Expedia.

Major averages hit their lows shortly after a headline crossed saying the IMF felt the interest rate volatility in the U.S. could have an adverse global effect and that economic risks remain tilted to the downside. The Dow Jones Industrial Average closed 3 points higher at 15,559, the S&P 500 Index gained 1 point (0.1%) to 1,692, and the Nasdaq Composite added 8 points (0.2%) to 3,613.

In economic news, consumer confidence unexpectedly increased in July to the highest level in six years as Americans’ views of their finances improved, according to the Thomson Reuters/University of Michigan final index of U.S. consumer sentiment. The measure advanced 1.2 points from mid-month to 85.1 in July; economists expected a slight uptick to 84.1. The improvement suggests stronger GDP growth in 2H while inflation expectations eased slightly.

Overseas, consumer prices in Japan excluding food rose 0.4 percent in June, more than economists estimated and the biggest jump since 2008, damping speculation the country will need to expand stimulus. In China, the government directed more than 1,400 companies in industries from steelmaking to papermaking to cut excess capacity by year-end.

In earnings news, Amazon.com reported a 2Q net loss of $0.02 per share, compared to the $0.05 per share profit that analysts had expected, as revenues rose 22% year-over-year (y/y) to $15.7 billion, roughly in line with the Street’s forecasts.

Elsewhere, Expedia recorded 2Q EPS ex-items of $0.64, well below the $0.79 that the Street was projecting, as revenues rose 16% y/y to $1.2 billion, compared to the $1.3 billion that analysts had expected.

The recovery off the lows wasn’t necessarily fueled by a single sector that was undeniably strong.  Five of the 10 S&P 500 industry sector indexes advanced, with the health sector (+0.7%) leading the gains while the materials sector (-0.4%) brought up the rear. With just three trading days left in the month, the S&P 500 is set to post its best month since October 2011. The Nasdaq’s advance makes July so far the best month in a year and a half.

For the week, the S&P 500 finished essentially flat – down just 0.03 pct – the first week in five that it did not manage a gain. But the benchmark index is up 5.3 percent so far in July. The Dow rose 0.1 percent for the week, extending its string of weekly gains.

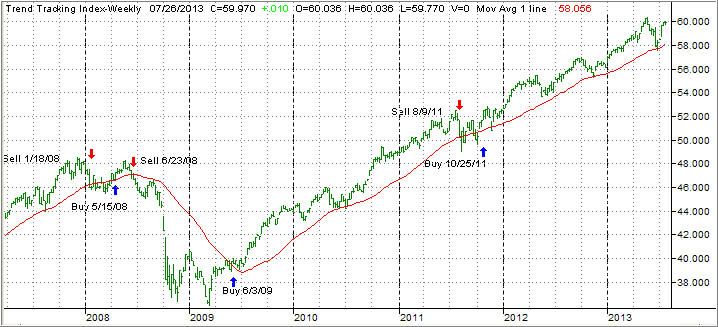
Our Trend Tracking Indexes (TTIs) closed the week as follows:

Domestic TTI: +3.32% (last week +3.47%)

International TTI: +6.66% (last week +6.76%)

Have a great week.

Ulli…

————————————————————-

READER Q & A FOR THE WEEK

All Reader Q & A’s are listed at our web site!
Check it out at:

http://www.successful-investment.com/q&a.php

A note from reader Jeff:

Q: Ulli: I noticed you repurchased VNQ on July 10th at $69.91 after the sell stop was triggered from the high of $78.15. I thought you mentioned you would not re-enter a position you were stopped out of until it went back of above its high ($78.15).  Please let me know if I’m misinterpreting your methodology.

A: Jeff: Yes; that is correct. However, there are 2 re-entry points. If VNQ breaks below its long-term trend line, then a crossing back above it would be the signal to buy back in. If, however, it does not break below its trend line, then the breaking of the previous high of 78.15 would be the re-entry point.

I have elaborated on this in my latest e-book as well.

———————————————————-

WOULD YOU LIKE TO HAVE YOUR INVESTMENTS PROFESSIONALLY MANAGED?

Do you have the time to follow our investment plans yourself? If you are a busy professional who would like to have his portfolio managed using our methodology, please contact me directly or get more details at:

https://theetfbully.com/personal-investment-management/

———————————————————

Back issues of the ETF/No Load Fund Tracker are available on the web at:

https://theetfbully.com/newsletter-archives/

ETF/No Load Fund Tracker Newsletter For Friday, July 26, 2013

Ulli ETF Tracker Contact

ETF/No Load Fund Tracker StatSheet

————————————————————-

THE LINK TO OUR CURRENT ETF/MUTUAL FUND STATSHEET IS:

https://theetfbully.com/2013/07/weekly-statsheet-for-the-etfno-load-fund-tracker-newsletter-updated-through-07252013/

————————————————————

Market Commentary

Friday, July 26, 2013

DOWN EARLY, BUT UP LATE

Despite starting the day sharply lower, the U.S. equity markets eked out gains to close the Friday session marginally higher. Stocks started the day to the downside in the wake of a 3% decline in the Japanese equity sell-off, as did a series of mixed earnings reports that featured notable misses from Amazon.com and Expedia.

Major averages hit their lows shortly after a headline crossed saying the IMF felt the interest rate volatility in the U.S. could have an adverse global effect and that economic risks remain tilted to the downside. The Dow Jones Industrial Average closed 3 points higher at 15,559, the S&P 500 Index gained 1 point (0.1%) to 1,692, and the Nasdaq Composite added 8 points (0.2%) to 3,613.

In economic news, consumer confidence unexpectedly increased in July to the highest level in six years as Americans’ views of their finances improved, according to the Thomson Reuters/University of Michigan final index of U.S. consumer sentiment. The measure advanced 1.2 points from mid-month to 85.1 in July; economists expected a slight uptick to 84.1. The improvement suggests stronger GDP growth in 2H while inflation expectations eased slightly.

Read More

Weekly StatSheet For The ETF/No Load Fund Tracker Newsletter – Updated Through 07/25/2013

Ulli ETF StatSheet Contact

ETF/Mutual Fund Data updated through Thursday, July 25, 2013

Table of Content082312

If you are not familiar with some of the terminology used, please see the Glossary of Terms.


1. DOMESTIC EQUITY MUTUAL FUNDS/ETFs: BUY — since 10/25/2011

TTI

The Domestic TTI broke through its long-term trend line generating a Sell for this area effective 8/9/2011. Over the recent past, we’ve seen the TTI hovering slightly below and above this dividing line between bullish and bearish territory. The clear break to the upside occurred on 10/24/11 and, effective 10/25/11, a new Buy signal for domestic equities went into effect.

As of today, our Trend Tracking Index (TTI—green line in above chart) has bounced off its long term trend line (red) by +3.49% after briefly dipping below it late in June.

To avoid a potential whip-saw, a Sell signal to move out of all domestic equity positions will be generated once we have clearly pierced the line to the downside. Be sure to tune in for the latest updates.

Read More