ETF/No Load Fund Tracker Newsletter For Friday, August 9, 2013
ETF/No Load Fund Tracker StatSheet
————————————————————-
THE LINK TO OUR CURRENT ETF/MUTUAL FUND STATSHEET IS:
https://theetfbully.com/2013/08/weekly-statsheet-for-the-etf-newsletter-through-08082013/
————————————————————
Market Commentary
Friday, August 9, 2013
MARKETS TURN SOUTH FOR THE FOURTH TIME TO CLOSE THE WEEK
U.S. equity markets closed the day lower as domestic data remained light and the lingering Fed taper uncertainty hamstrung equities, despite some upbeat Chinese economic data. Investors pulled almost $1.20 billion from U.S. equity exchange-traded funds over the past four days, according to data compiled by Bloomberg from about 1,500 funds.
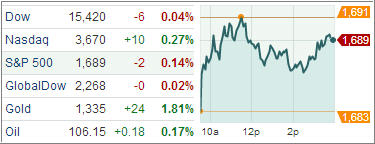
About $32 billion of deposits went into the funds in July, the most since September 2008, the data show. The Dow Jones Industrial Average closed 73 points lower (0.5%) at 15,426, the S&P 500 Index dropped 6 points (0.4%) to 1,691, and the Nasdaq Composite lost 9 points (0.2%) to 3,660.
Domestic economic data was limited to wholesale inventories which s fell 0.2% in June, contrary to expectations for a 0.5% gain. The decline was the third in row, resulting in 1.7% annualized drop in Q2. This suggests the inventory investment contribution to GDP would likely be revised lower, as wholesale inventories account for about 1/3 of total inventories. Shortly after opening in the red, the S&P index briefly turned positive, but just like yesterday, it was unable to make a sustained move above the 1,700 level.
One positive news came out of China as its industrial production rose more than expected, with growth accelerating from June, while fixed asset investment and new yuan loans both came in north of economists’ expectations. Elsewhere, the nation’s consumer and producer prices came in slightly cooler than forecasted, while retail sales rose by a smaller amount than anticipated and aggregate financing missed expectations.
Nine of ten sectors ended in the red while materials outperformed with a gain of 0.6% thanks to China’s data. The materials sector was the only group that registered a gain this week, rising 0.8%.
Wall Street posted its worst week since June with Fed weighing heavily. For the week, the Dow fell 1.5 percent, snapping a six-week string of gains. The S&P 500 dropped 1.1 percent and the Nasdaq slid 0.8 percent. Just a week ago, both the Dow and the S&P 500 ended at record closing highs.
Our Trend Tracking Indexes (TTIs) slipped as well and closed the week as follows:
Domestic TTI: +3.30% (last week +3.90%)
International TTI: +6.85% (last week +7.45%)
Have a great week.
Ulli…
————————————————————-
READER Q & A FOR THE WEEK
All Reader Q & A’s are listed at our web site!
Check it out at:
http://www.successful-investment.com/q&a.php
A note from reader Rash:
Q: Ulli: I find it very surprising that while the bond portfolio has not done very well in the face of interest rate headwinds, the conservative and income portfolios have done so much better than the rest.
Is this because of following buy/sell/hold signals or choice of ETFs or something else? I would have thought the equity heavy portfolios would have done better and the bond portfolios worse in general, but while the bond portfolio is the worst, performance of the rest has left me confused. Appreciate any explanation.
A: Rash: We have been in a declining interest rate environment for many years that it seems unusual for rates to go up and bond portfolios to head south. However, such is one of the unintended consequences of manipulating the financial markets as the Fed has done.
The Fed’s goal has been to create the so called wealth effect, which in theory gets people to spend more money therefore contributing to economic growth. The tool of choice for accomplishing that has been the stock market and, via the various QE programs of the past few years, the indexes have been consistently pushed to new highs. As I have posted before, there has been a total disconnect between the stock market levels and the underlying economy, which eventually will have to re-adjust itself, in my view, via a market correction.
As a result, standard portfolio allocations have been skewed and the simple holding of one or more equity index funds, as described in my new e-book, using the Trend Tracking/Sell Stop approach would have increased performance dramatically.
———————————————————-
WOULD YOU LIKE TO HAVE YOUR INVESTMENTS PROFESSIONALLY MANAGED?
Do you have the time to follow our investment plans yourself? If you are a busy professional who would like to have his portfolio managed using our methodology, please contact me directly or get more details at:
https://theetfbully.com/personal-investment-management/
———————————————————
Back issues of the ETF/No Load Fund Tracker are available on the web at:
https://theetfbully.com/newsletter-archives/