Earnings Take Center Stage

Ulli Market Commentary Contact

Thur pic

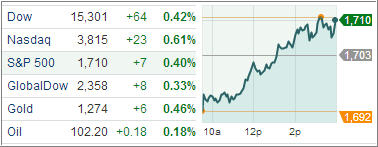
[Chart courtesy of MarketWatch.com]

U.S. equity markets closed mostly in the positive sending the S&P 500 to record high, while disappointing earnings reports pushed the Dow slightly lower. Early session pessimism that last night’s short-term agreement by Congress may only be delaying another fiscal showdown to early next year, was met with optimism that tapering of the Fed’s asset purchase program may be pushed out.

Meanwhile, Treasuries were higher in the wake of the deal agreement on Capitol Hill, while weekly jobless claims came in above expectations and regional manufacturing activity decelerated by a smaller rate than forecasted.

With the third quarter earnings season heating up, the Dow Jones Industrial Average was victimized by disappointing results with IBM and Goldman Sachs missing the Street’s revenue forecasts, and UnitedHealth issuing disappointing guidance, which offset stronger-than-expected quarterly results from Verizon Communications and American Express.
Read More

Market Signals Government Shut Down Is Ending

Ulli Market Commentary Contact

Wed pic

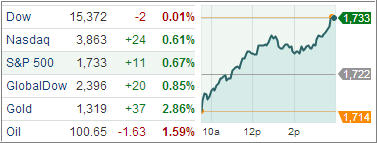
[Chart courtesy of MarketWatch.com]

Domestic equity markets closed the trading session sharply higher as the fiscal stalemate on Capitol Hill is expected to possibly end a day before the Treasury’s debt ceiling is reached. The Senate is agreeing to a plan that will be voted on by the House later today.

The day’s gains brought the S&P 500 within a few points of its all-time closing high. Volume has been below average, however, as many investors stayed on the sidelines until a resolution of the fiscal issues was official. Meanwhile, Treasuries moved to the upside on the eased concerns about a U.S. debt default.

In earnings news, Bank of America, Dow member Intel, Yahoo, PepsiCo, and CSX all reported bottom-line results that exceeded analysts’ expectations. However, Stanley Black & Decker experienced heavy losses after cutting its full-year earnings outlook. Elsewhere, gold was lower; crude oil prices were higher, while the U.S. dollar was nearly unchanged.

Read More

7 ETF Model Portfolios You Can Use – Updated through 10/15/2013

Ulli Model ETF Portfolios Contact

Last week’s rebound, powered by endless hope that the government shutdown will come to an end over the past weekend, slowed down as the major indexes pulled back on lack of progress among the warring parties.

Still, the S&P 500 managed to tack on 2.6% since last week’s model portfolio report, just about recouping the prior week’s losses. Despite earnings season being on the menu, all eyes are focused on the Washington debacle with the potential fall guy being the market should things not come to a resolution fairly quickly.

In the meantime, here’s the latest ETF Model Portfolio update:

Read More

Uncertainty Hurts Stock Index ETFs

Ulli Market Commentary Contact

Tue pic

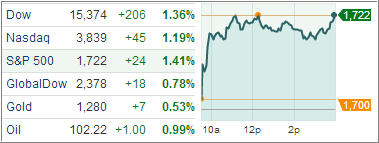
[Chart courtesy of MarketWatch.com]

U.S. equity markets finished near their lows in a volatile session following a four day rally in the Standard & Poor’s 500 Index, as yesterday’s optimism that a deal among U.S. lawmakers was close seemed to slip away in the wake of continued bickering among the political parties that have stalled the talks.

After the market closed, futures indicated continued pressure after Fitch placed the United States’ AAA rating on rating watch negative, citing the debt ceiling gridlock.

Markets displayed modest losses at the open, but were able to turn positive by late afternoon. The rebound was based on optimism associated with the budget jawboning in Washington. However, selling pressure intensified during the final 90 minutes of the session amid indication that the Senate has halted its negotiations pending the outcome of the House vote.

Read More

Stocks Bounce Higher After Shaky Start

Ulli Market Commentary Contact

Mon pic

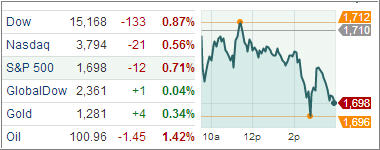
[Chart courtesy of MarketWatch.com]

After beginning the day lower on the failure of U.S. lawmakers to come to a debt ceiling agreement to avoid a potential default, stocks ended a volatile session with modest gains to finish higher as bits of news about potential progress came throughout the day. Volume was lighter than usual due to the closure of U.S. bond markets for Columbus Day.

The domestic economic calendar was also empty, while several markets overseas were closed for holidays. Stocks slumped at the open after the weekend ended without any concrete progress in Washington. Despite the opening weakness, dip-buyers were quick to step in, drawing encouragement from late-morning reports indicating a bipartisan meeting was scheduled to take place at the White House.

The rebound continued into the afternoon with upbeat quotes from lawmakers providing additional support. A brief slip ensued during the final 90 minutes of the session when the White House meeting was postponed in order to allow more time for talks. Strikingly, the market did not appear too concerned with the cancellation as the major averages ended the session on their highs.

Read More

ETFs/Mutual Funds On The Cutline – Updated Through 10/11/2013

Ulli ETFs on the Cutline Contact

Below are the latest ETF Cutline reports, which show how far above or below their respective long-term trend lines (39 week SMA) my currently tracked ETFs/MFs are positioned.

The first report covers the ETF Master List from Thursday’s StatSheet and includes 398 ETFs, of which currently 327 (last week 321) are hovering in bullish territory.

The second report includes only High Volume ETFs. To clarify, High Volume (HV) ETFs are defined as those with an average daily volume of $10 million or higher.

These ETFs are generated from my selected list of some 93 that I use in my advisor practice. It cuts out the “noise,” which simply means it eliminates those ETFs that I would never buy because of their volume limitations. 69 ETFs (last week 66) have managed to remain in bullish territory after the recent market volatility.

The third report covers Mutual Funds on the Cutline. There are currently 800 (last week 795) above the line and 59 below it out of the 859 that I follow.

Take a look:

1. ETF Master Cutline Report     

2. ETF High Volume Cutline Report

3. MF Cutline Report

In case you are not familiar with some of the terminology used in the reports, please read the Glossary of Terms.

If you missed the original post about the Cutline approach, you can read it here.