ETF/No Load Fund Tracker Newsletter For Friday, August 30, 2013
ETF/No Load Fund Tracker StatSheet
————————————————————-
THE LINK TO OUR CURRENT ETF/MUTUAL FUND STATSHEET IS:
https://theetfbully.com/2013/08/weekly-statsheet-for-the-etfno-load-fund-tracker-newsletter-updated-through-08292013/
————————————————————
Market Commentary
Friday, August 30, 2013
MAJOR INDEX ETFS END AUGUST ON DOWN NOTE
U.S. stocks snapped their recent two-day winning streak to fall in a thinly traded session as the S&P 500 index recorded its worst loss since May 2012. Stocks struggled following a report that showed U.S. consumer spending and income were softer than forecasted, which overshadowed a larger-than-expected upward revision to consumer sentiment.
Investors also avoided making large bets before a long weekend with the situation in Syria still uncertain. The Dow Jones Industrial Average closed 31 points lower (0.2%) at 14,810, the S&P 500 Index lost 5 points (0.3%) to 1,633, and the Nasdaq Composite decreased 30 points (0.8%) to 3,590.
Afternoon trading was volatile, with indexes swinging from break-even levels to their lows as U.S. Secretary of State John Kerry commented on the Syrian situation, implying the U.S. will act alone if necessary. While buying interest was somewhat scarce, the CBOE Volatility Index rose 0.8% as participants demanded some downside protection. Reviewing today’s economic data, personal income edged up 0.1% in July, below the consensus of 0.2%. Meanwhile, spending levels were also weak. Consumption grew 0.1% in July; the consensus expected an increase of 0.3%.
Eight of ten sectors ended in the red with influential cyclical groups weighing on the broader market. Home builders settled on their lows as the iShares Dow Jones US Home Construction fell 1.9%. Retailers also slumped as the SPDR S&P Retail ETF lost 0.8%.
Elsewhere, the industrial sector succumbed to the pressure exerted by transportation companies as the Dow Jones Transportation Average fell 1.1%. On the upside, consumer staples (XLP) added 0.3% and the weakest sector of the month, utilities, tacked on a slim gain of less than 0.1%.
The S&P 500 fell 3.1 percent in August and lost 1.8 percent for the week in a third decline in the past four weeks. The Nasdaq fell 1.9 percent for the week while the Dow slid 1.3 percent in its fourth straight weekly loss. For the month, the Dow fell 4.4 percent and the Nasdaq lost 1 percent.
U.S. markets will be closed on Monday in observance of Labor Day but investors will have plenty on their minds next week. Any potential action in Syria, and the impact on both oil prices and global growth, may have an effect on monetary policy globally.
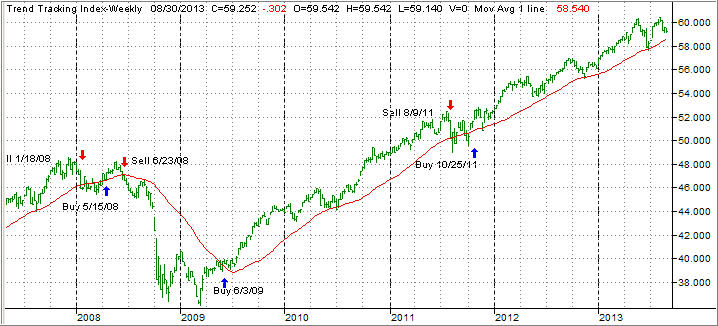
Our Trend Tracking Indexes (TTIs) slipped from last Friday and closed the week as follows:
Domestic TTI: +0.84% (last week +1.85%)
International TTI: +2.43% (last week +5.18%)
Have a great week.
Ulli…
————————————————————-
READER Q & A FOR THE WEEK
All Reader Q & A’s are listed at our web site!
Check it out at:
http://www.successful-investment.com/q&a.php
A note from reader Robert:
Q: Ulli: I am a US Government employee with my retirement funds in the governments Thrift Savings Plan. As I’m sure you know our plan enables us to invest in an international fund which tracks the EAFE.
With Europe beginning to get back on its feet, coupled with China, do you believe I would get more return with the international fund than investing in a fund which tracks the S&P 500.The international fund is lagging behind for the year so far but would it be a good bet going forward? Thanks for your attention…I faithfully read all of your market commentaries and look forward to next week.
A: Robert: You could go that route as long as you use my recommended sell stop discipline to protect or limit the downside risk.
While a couple of data points have indeed been positive, long-term, I think Europe will be a disaster.
Right now, appearances are everything as the German elections loom in September. There is nothing positive in any of the countries like Spain, Italy, Portugal and even France, which are basically insolvent.
I still think the U.S. is least dirty shirt in the basket, so my investment theme for this year has been domestic, and I don’t see any good argument to change that. Of course, all my thinking will change once the domestic trend line crosses into bear market territory.
———————————————————-
WOULD YOU LIKE TO HAVE YOUR INVESTMENTS PROFESSIONALLY MANAGED?
Do you have the time to follow our investment plans yourself? If you are a busy professional who would like to have his portfolio managed using our methodology, please contact me directly or get more details at:
https://theetfbully.com/personal-investment-management/
———————————————————
Back issues of the ETF/No Load Fund Tracker are available on the web at:
https://theetfbully.com/newsletter-archives/

 First Trust, the Wheaton, Illinois-based provider of exchange-traded products known for its niche strategies, has launched a non US-focused ETF that seeks to provide income sans volatility through a diverse international portfolio of high yielding securities.