The ETF/No Load Fund Tracker
Monthly Review—August 31, 2013
Major Equity Indexes Slip And Slide During August
All major domestic indexes headed south during the month of August as higher interest rates, continued taper talk and the Syrian war drums proved to be too much of an obstacle to overcome.
The month started out positive with the S&P 500 reclaiming its psychologically important 1,700 level during the first few days, but that was the highlight. The benchmark index, and our major holdings in XLP and DVY, reversed their trend and headed towards bear market territory.
The pullback was slow and steady with only a few brief dead cat bounces as the following chart shows:
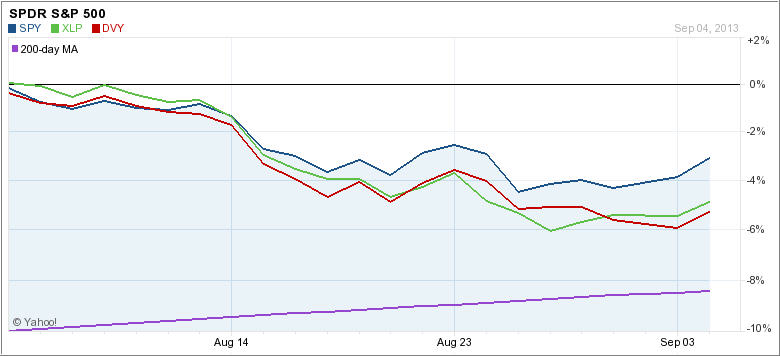
It’s interesting to note that none of our trailing sell stops were triggered, although XLP came within 1% of being liquidated but, towards the end of the month, all indexes headed back up slightly.
Looking at the big picture, our main gauge, the Domestic Trend Tracking Index (TTI), slipped as well and, on the last trading day of the month, came within 0.84% of signaling an “all-out” liquidation for our domestic holdings. Here’s the TTI chart:
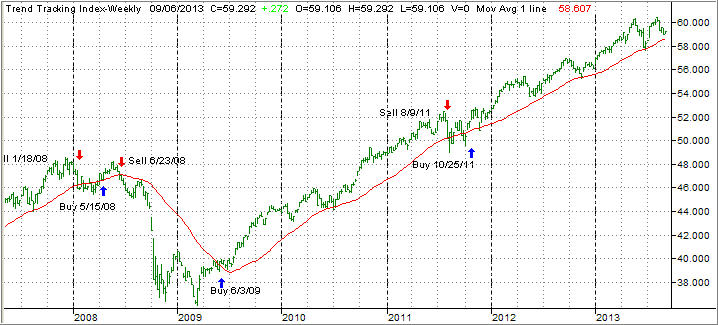
We currently remain above the trend line and will continue to hold on to our current positions. This week’s payroll report and unemployment rate may give us some clue as to whether the Fed will actually reduce its QE efforts or not.
Current consensus is that they will follow through and implement a reduction, however, if the reports come in worse than expected, like less job creation and a higher unemployment rate, you could see a huge rebound rally as bad news is good news, and the Fed’s tapering may not actually happen. If the fact that economic bad news can actually be good news for the markets sounds perverse to you, you’re not alone.
We are living in a world where unintended consequences can influence markets all of a sudden, which means that we always have to be prepared to step aside to the safety of the sidelines. Whether it’s “taper talk” by the Fed, or the beating of the Syrian war drums, depending on the magnitude of the news event, markets can rally in the face of adversity or sink and head towards bear territory on what you and I might consider positive developments.
The trend is not only our friend, but also the only thing that is real in this all too unreal environment. As always, I will be prepared to execute our sell stops when the markets tell me that it’s time to do so. Not having an exit strategy under these conditions can be very costly to your financial health once the inevitable correction occurs.