ETF/No Load Fund Tracker Newsletter For Friday, September 13, 2013
ETF/No Load Fund Tracker StatSheet
————————————————————-
THE LINK TO OUR CURRENT ETF/MUTUAL FUND STATSHEET IS:
https://theetfbully.com/2013/09/weekly-statsheet-for-the-etfno-load-fund-tracker-newsletter-updated-through-09122013/
————————————————————
Market Commentary
Friday, September 13, 2013
MAJOR INDEX ETFs END THE WEEK HIGHER ON NEGATIVE DATA
Domestic equity markets ended in positive territory and the Dow registered its best weekly gain since January, despite lackluster reads on U.S. consumer sentiment and retail sales, while investors contemplate the odds that the Federal Reserve will taper stimulus measures at next week’s policy meeting.
Moreover, Syrian uncertainty remained, with diplomatic discussions continuing regarding the Syrian government relinquishing control of its chemical weapons. The Dow Jones Industrial Average closed 75 points higher (0.5%) at 15,376, the S&P 500 Index ended up 5 points (0.3%) at 1,688, and the Nasdaq Composite increased 6 points (0.2%) to 3,722.
Today’s session was very quiet as participants displayed tepid demand for equities ahead of next week’s meeting where a tapering announcement may occur. Excluding a brief dip during the opening hour after it was reported that the Consumer Sentiment Index fell 5.3 points in the preliminary September reading, the biggest drop this year, to 76.8, the lowest level in five months. Economists expected a smaller pullback.
Typically, consumer sentiment follows trends in employment, equity prices, oil prices, and media reports. Since the end of August, the Syria debate has caused oil prices to increase; and the most recent August employment gains were much weaker than expected. Equity prices, however, have been moving higher.
Despite the temporary slide into negative territory, the key indices were able to reclaim and hold their early highs into the close. Cyclical sectors ended mixed. Energy (+0.1%), financials (+0.2%), and industrials (+0.2%) lagged; discretionary shares (+0.3%) ended in-line; and materials (+0.7%) outperformed. Similar to cyclical sectors, defensive groups were mixed. Telecom services (+0.2%) lagged while consumer staples (+0.8%) and utilities (+0.8%), outperformed. For its part, the health care sector (+0.3%) ended in-line with the S&P.
The equity markets finished solidly higher on the week, despite next week’s highly-anticipated monetary policy meeting by the Federal Reserve, as some stronger-than-expected global data boosted economic optimism. The Dow was a standout performer, posting three sessions of triple-digit gains.
The S&P 500 rose 2 percent for the week, its best gain in about two months, yet its trading range has narrowed sharply this week and that trend is expected to continue until the Fed announcement. The Nasdaq posted a 1.7 percent gain for the week.
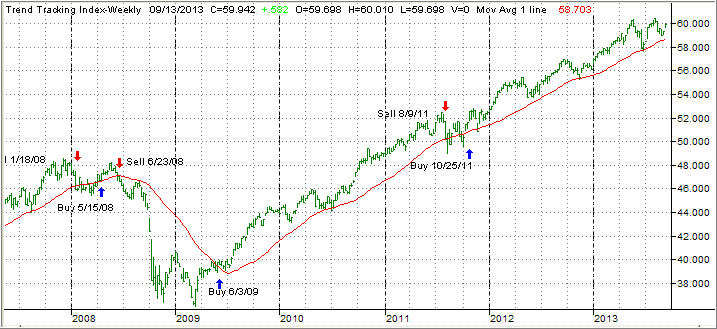
Our Trend Tracking Indexes (TTIs) joined the party and closed higher:
Domestic TTI: +2.29% (last week +1.28%)
International TTI: +6.15% (last week +4.31%)
Have a great week.
Ulli…
————————————————————-
READER Q & A FOR THE WEEK
All Reader Q & A’s are listed at our web site!
Check it out at:
http://www.successful-investment.com/q&a.php
A note from reader Scott:
Q: Ulli: What is the sell stop rule on an ETF Bond fund? Is it the same as on a Mutual Bond Fund?
A: Scott: Yes; it’s the same for either. I use 5%, and we’ve been out of bonds months ago when the stop was triggered.
———————————————————-
WOULD YOU LIKE TO HAVE YOUR INVESTMENTS PROFESSIONALLY MANAGED?
Do you have the time to follow our investment plans yourself? If you are a busy professional who would like to have his portfolio managed using our methodology, please contact me directly or get more details at:
https://theetfbully.com/personal-investment-management/
———————————————————
Back issues of the ETF/No Load Fund Tracker are available on the web at:
https://theetfbully.com/newsletter-archives/