Weekly StatSheet For The ETF/No Load Fund Tracker Newsletter – Updated Through 12/05/2013

Ulli ETF Tracker Contact

ETF/Mutual Fund Data updated through Thursday, December 5, 2013

Table of Content082312

If you are not familiar with some of the terminology used, please see the Glossary of Terms.


1. DOMESTIC EQUITY MUTUAL FUNDS/ETFs: BUY — since 10/25/2011

TTI

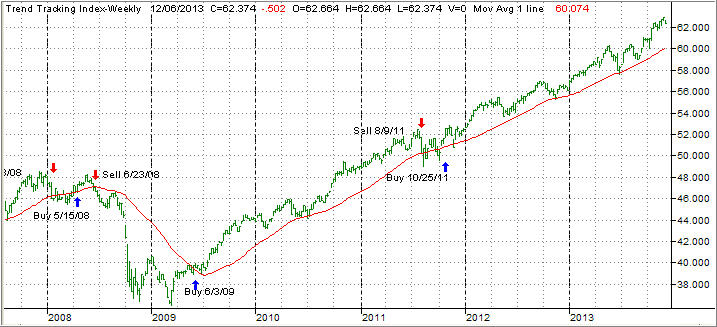
Our main directional indicator, the Domestic Trend Tracking Index (TTI) broke through its long-term trend line generating a Sell for this area effective 8/9/2011. Over the recent past, we’ve seen the TTI hovering slightly below and above this dividing line between bullish and bearish territory. The clear break to the upside occurred on 10/24/11 and, effective 10/25/11, a new Buy signal for domestic equities went into effect.

As of today, our Trend Tracking Index (TTI—green line in above chart) has bounced off its long term trend line (red) by +4.01% after briefly dipping below it late in June 2013.

To avoid a potential whip-saw, a Sell signal to move out of all domestic equity positions will be generated once we have clearly pierced the line to the downside. Be sure to tune in for the latest updates.

Read More

Fed Uncertainty Sends The Dow, S&P 500 Down For Fifth Day

Ulli Market Commentary Contact

Thur pic

[Chart courtesy of MarketWatch.com]

1. Moving The Markets

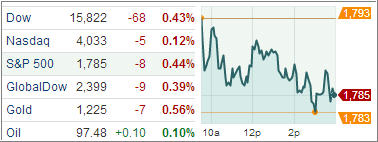
The Dow and the S&P 500 are in their worst stretch since September and are on track to post their first negative week since late September. However, the declines have been slight, with the S&P 500 down about 1.2 percent over the period.

Gross domestic product grew at an annualized rate of 3.6 percent in the third quarter, the fastest pace since the first quarter of 2012 and faster than the 3 percent rate that had been expected. Another report showed that the number of Americans filing new claims for unemployment benefits unexpectedly fell last week in a hopeful sign for the labor market – a day ahead of the November nonfarm payrolls report.

Global markets remain worried alongside the U.S., with Japan’s Nikkei shedding 1.5 percent and The FTSEurofirst 300 index dropping 1% on Thursday.

In emerging markets, The Goldman Sachs Group, Inc. (GS) is now telling the market that next year (2014) will not only be the “Year of the Horse” in the Chinese Zodiac, but it will also be a buying opportunity in Chinese stocks (FXI). Goldman Sachs is predicting that the Hong Kong-based Hang Seng China Enterprises Index, which is available for investment by foreign investors, will surge 19% in 2014. So far, the trends in FXI don’t support those ideas as FXI has been stuck in a wide sideways pattern since 2009.

Our ETFs in the Spotlight retreated with the indexes but have come off their highs only modestly as the chart below shows:

Read More

12-05-2013

Ulli Newsletter Archives Contact

The ETF/No Load Fund Tracker

Monthly Review—November 30, 2013

US Equities Finish November On A High; Europe Sputters

US equities continued their bull run in November with all the three major indexes finishing higher for the month. The Dow Jones Industrial Average and the S&P 500 remained comfortably above their milestone levels of 16,000 and 1,800, respectively, and marked their eighth straight week of advances.

The Dow finished at 16,086.41, up 3.5 percent for November. The S&P 500 closed out at 1,805.81, higher 2.8 percent for the month.

The tech-heavy NASDAQ Composite index climbed 3.6 percent for the month to finish at 4,059.89.

The FOMC minutes from the Fed’s October meeting suggested the central bank could slow the pace of its asset purchases if the labor market showed persistent improvement, causing small hiccups in equities. The markets, however, showed remarkable resilience and recovered quickly, possibly realizing the Fed minutes really didn’t tell anything that the markets didn’t already know. Also, traders seemed to warming up to the Fed’s articulation that a tapering isn’t a tightening, and the Fed funds rate is apt to stay near the zero mark even well after the central bank ends its monthly bond buying program.

Another critical development related to the Fed for the month was the near certainty of Janet Yellen’s confirmation as the next Fed chairman following her appearance before the Senate Banking Committee. The change in leadership is likely to be smooth next year as Fed chairman Ben Bernanke and Yellen seem to be on the same page about the health of the economy.

On the economic data front, consumer sentiment and labor market readings indicated a slow but steady economic recovery. The final November reading of the consumer sentiment index came in at 75.1, bettering October’s reading of 73.2 even as consumers remained skeptical about the congressional deadline for reaching a settlement on the federal budget and debt ceiling.

Separately, a report by the Labor Department showed jobless claims fell by 10,000 to 316,000 in the week ended Nov 23. Economists had called for a rise to 330,000 on a seasonally adjusted basis.

Orders for durable goods fell by 2 percent in October, suggesting weakness in business investments, the Commerce Department said on Nov 27. The lack of bookings for commercial and military jets in the more volatile transportation sector hit October readings.

Orders for durable goods have increased by 4.8 percent in the first 10-months of 2013 while core orders have grown by a lackluster 4.1 percent, the October report said.

Among other economic developments, wholesale inventories ticked up 0.4 percent in September after an upwardly revised 0.8 percent gain in August.

Export prices, excluding agriculture, fell 0.4 percent in October following a 0.3 percent gain in the previous month. Import prices remained unchanged following September’s uptick of 0.2 percent.

Across the Atlantic, European stocks tracked their US counterparts. The Stoxx Europe 600 index closed at 325.16, up 0.9 percent for the month. The pan-European index is up 16.3 percent year to date.

The German DAX 30 index led the region’s advance in November, adding 4.1 percent for the month. Both the French CAC 40 and British FTSE 100 index shed 1.2 percent in November.

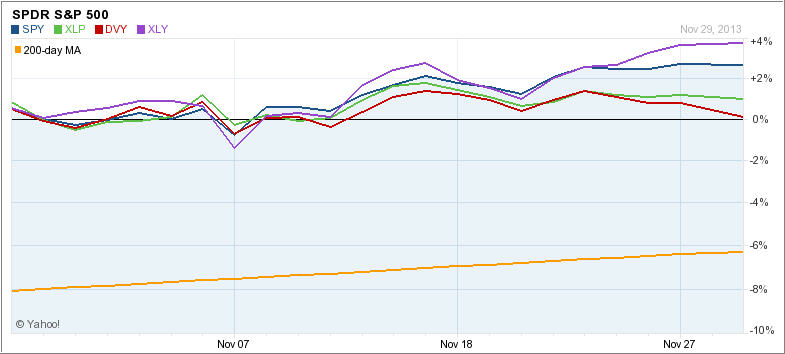
Our major holdings meandered with the markets with XLY taking the lead followed by SPY. DVY dragged as it gained only slightly while XLP slowed down from the torrid pace it set in October. Take a look at the chart:
Monthly Chart

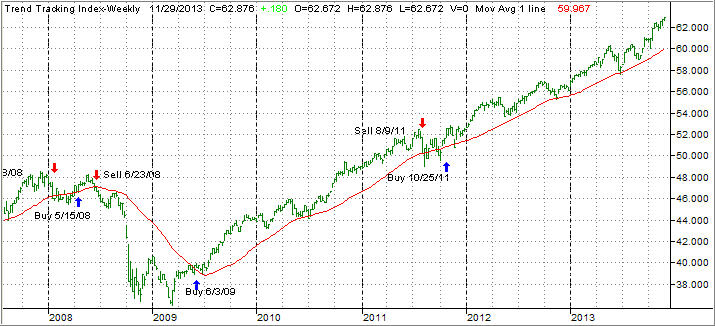
Our main directional indicator, the Domestic Trend Tracking Index (TTI) kept pace with the major indexes and remains solidly on the bullish side of the trend line, as the chart shows:
TTI

November turned out to be another good month for those of us invested in equities. It almost seems to be a surreal market environment, which is not surprising given the fact the Fed has determined market direction ever since its introduction of the various stimulus programs.

Surely, there will have to be some kind of pullback in the near future if for other reason than profit taking and/or some sense of reality creeping in. This is also the time when you will hear latest proclamations and estimates as to how high these markets will go next year. Goldman Sachs was the first one in stating that the S&P 500 will fall by 10% over the next 12 months before rallying to the 1,900 level by year end 2014. Then it’s on to 2,100 by the end of 2015 and 2,200 by the end of 2016.

Of course, this is all guesswork and it behooves you to pay no attention. We have our trailing sell stops indentified and will execute them when necessary in accordance with our exit strategy.

Markets Down, Jobs Up!

Ulli Market Commentary Contact

Wed pic

[Chart courtesy of MarketWatch.com]

1. Moving The Markets

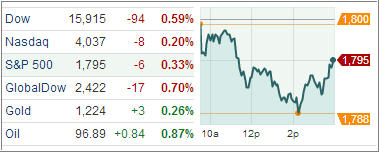
The Dow and the S&P 500 closed down for a fourth consecutive session as uncertainty grew over when the Federal Reserve will start to slow its stimulus. The decline today coincides with the updated employment numbers arriving from ADP. Private sector job creation surged in November; with ADP reporting 215,000 (higher than the 173,000 forecast) new jobs in a number that could also put some heat on the Federal Reserve to begin reducing its monthly stimulus.

European equities also closed lower on Wednesday for a third-straight day, following the U.S. markets in concerns over the Fed. Also in Europe, bank stocks saw a sell-off today. Some of the world’s biggest banks were hit with a 1.7 billion euro ($2.3 billion) fine for interest rate-rigging by traders, the largest fine ever imposed by the European Commission (EC).

In housing, the average rate for a 30-year mortgage fell 30 basis points from September to October, and new home sales responded with their biggest monthly jump in more than 33 years. With rates on the rise, new home sales may dip again, though.

The Direxion Daily FTSE China Bull 3X Shares (YINN) and Direxion Daily FTSE China Bear 3X Shares (YANG) will begin following their new index on 12 December, making them the first pair of 3X leveraged and inverse ETFs in the US to track this composite, which offers exposure to some of the most prominent companies in China.

Our ETFs in the Spotlight continued to slip off their highs. Let’s take a look:

Read More

Equity ETFs Remain Red While Mortgage ETFs Gain Ground

Ulli Market Commentary Contact

Tue pic

[Chart courtesy of MarketWatch.com]

1. Moving The Markets

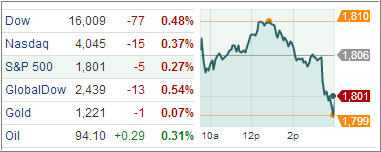
U.S. stocks fell for a third straight session, dropping from record levels in a broad decline as investors took profits amid signs of a weak holiday shopping season. Retail and consumer discretionary stocks were among the weakest of the day. Amazon.com Inc slipped 2 percent to $384.66 and was one of the biggest drags on the S&P 500. Some investors might simply be locking in profits after eight weeks of gains, while others might be fearful of the Fed beginning to taper the stream of cash it’s pumping into the economy.

On a more global scale, the yen advanced against the dollar and the euro on Tuesday, reversing losses sustained earlier in the global trading day, as falling stock markets worldwide sent traders into the relative safety of the Japanese currency. This was perhaps a factor in Japan’s Nikkei share average rising to its highest close in six years today. Brazil’s economy contracted in the third quarter for the first time since early 2009 as a steep drop in investment showed flagging confidence in what was recently one of the world’s most attractive emerging markets.

Mortgage REIT ETFs are gaining focus on renewed taper concerns. The declining delinquency rates coupled with an increasing credit balance in turn enhances credit quality of the firms, making the conditions ideal for investing in the mortgage finance industry. Further, stable job markets, rising home sales, higher home prices and still-low mortgage interest rates are compelling homeowners to finance more loans.

Our ETFs in the Spotlight continued to slip off their highs but remain in bullish territory:

Read More

Window Shoppers Prevail But USDs Still Appreciating

Ulli Market Commentary Contact

Mon pic

[Chart courtesy of MarketWatch.com]

1. Moving The Markets

Shoppers spent less over the Thanksgiving weekend and that weighed on stocks Monday. While they turned out in record numbers in the four days ending Sunday they plunked down less cash than they did last year. It was the first decline in Thanksgiving weekend spending since a retail trade group began tracking it in 2006. Investors reacted by selling all types of retailer stocks, from department stores to specialty chains. J.C. Penney, Target and Coach fell more than 1 percent each. Urban Outfitters dropped 3.5 percent.

The dollar is up against its major competitors at the start of the new trading week. The U.S. currency recovered from early weakness Monday and has extended its gains following the unexpected increase in the ISM manufacturing index. There will be a number of important U.S. economic reports released later this week, including GDP on Thursday and the U.S. jobs report for November on Friday.

All ETF sectors, except for Energy and Health Care, closed in the red zone Monday. Already reeling from some sour November performances, precious metals mining ETFs have started the last month of the year in similar fashion to how they ended the previous month: Ugly.

A rocky 2013 for emerging markets exchange traded funds in terms of investor redemptions continued in November and looks to do the same in December, with diversified funds tracking developing world economies witnessing $3.6 billion of outflows last month. Of the 10 worst ETFs in terms of 2013 outflows, five are emerging markets funds, including FXI and the iShares MSCI Brazil Capped ETF (EWZ), according to BlackRock data.

Our ETFs in the Spotlight pulled slightly off their highs, so let’s take a look:

Read More