ETF/No Load Fund Tracker Newsletter For Friday, September 27, 2013
ETF/No Load Fund Tracker StatSheet
————————————————————-
THE LINK TO OUR CURRENT ETF/MUTUAL FUND STATSHEET IS:
https://theetfbully.com/2013/09/weekly-statsheet-for-the-etfno-load-fund-tracker-newsletter-updated-through-09262013/
————————————————————
Market Commentary
Friday, September 27, 2013
UNSOLVED GOVERNMENT SHUT DOWN SINKS STOCKS
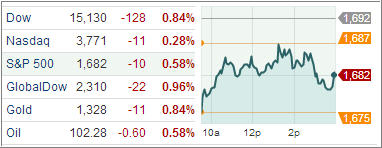
Domestic equity markets closed the trading session in the red on Friday, and the S&P 500 and Dow posted their first weekly drop in four, as sentiment continued to remain hamstrung by U.S. fiscal issues, with the deadline for Congress to avoid a government shutdown on Monday and the debt ceiling approaching.
Time was running short for lawmakers to avert a partial shutdown of operations by the U.S. government on October 1. The Dow Jones Industrial Average closed 70 points lower (0.5%) at 15,258, the S&P 500 Index ended down 7 points (0.4%) at 1,692, and the Nasdaq Composite decreased 6 points (0.2%) to 3,782. Meanwhile, Treasuries were higher amid the domestic fiscal concerns, while U.S. economic reports showed personal income and spending rose and consumer sentiment was revised higher.
Today’s data was mostly positive in terms of the health of the consumer – the biggest contributor to US economic growth – with personal income posting the largest increase since February, and personal spending registering the fourth-consecutive monthly increase.
Meanwhile, the final University of Michigan Consumer Sentiment Index showed consumers’ psyches were better than originally reported. There is allegedly no evidence in the economic data that shows signs of a recession. A government shutdown, however, would be a fiscal cliff that’s big enough in this case to drive the economy into a recession. Investors are increasingly worried about that risk as it seems to be rising.
The Nasdaq outperformed today as biotechnology overshadowed the underperformance of the tech sector (-0.6%). The iShares Nasdaq Biotechnology ETF added 0.3%, also contributing to the relative strength of the health care sector, which tacked on 0.1%. Another pocket of relative strength could be found among discretionary shares (XLY +0.1%). Even though homebuilders lagged and the iShares Dow Jones US Home Construction ETF lost 1.3%, the sector received support from apparel manufacturers.
Concerns over the budget debate have weighed on sentiment throughout the week, contributing to the weakness in the S&P. The Index declined 1.1 percent for the week and is roughly 2 percent below its record high. The Dow also saw the first weekly decline since August, down 1.3 percent. Meanwhile, the Nasdaq displayed relative strength and finished the week with a slim gain of 0.2%.
Despite this week’s market weakness, our Trend Tracking Indexes (TTIs) headed higher and closed as follows:
Domestic TTI: +3.32% (last week +2.29%)
International TTI: +6.90% (last week +6.15%)
Have a great week.
Ulli…
————————————————————-
READER Q & A FOR THE WEEK
All Reader Q & A’s are listed at our web site!
Check it out at:
http://www.successful-investment.com/q&a.php
A note from reader Bill:
Q: Ulli: On 9-6-13, FOCPX dropped 8.8% about $6.66 per share. I called a Fidelity rep and he said because Apple fell 9-10% and FBIOX also declared and paid a Capital Gain and Dividend of around $1.189 per share, but it’s sort of floundering around not moving and actually down three days in a row for the last three days.
I guess my question is, are people getting out because of that drop and should I get out also?
I understand when a lot of people get out of a fund they have to sell off and that makes the fund drop.
A: Bill: Here’s how I look at it:
FOCPX made a high of 80.84 on 8/5/13, which would be the number to use for your trailing sell stop. Say, 7.5% of that high would put a sell signal at a break below 74.78, which happened only briefly before this fund recovered. I could not verify the distribution of $1.19.
If that is in fact correct, you need to reduce the high price by that amount, which would make the new high $79.65. Now you calculate the sell stop point of 7.5%, which brings it down to $73.68, which has not been reached yet.
That’s the process I go through to determine if a stop has been triggered. If it has, I will execute the next day, unless there is a huge rebound in the making.
Hope that clarifies your thinking
———————————————————-
WOULD YOU LIKE TO HAVE YOUR INVESTMENTS PROFESSIONALLY MANAGED?
Do you have the time to follow our investment plans yourself? If you are a busy professional who would like to have his portfolio managed using our methodology, please contact me directly or get more details at:
https://theetfbully.com/personal-investment-management/
———————————————————
Back issues of the ETF/No Load Fund Tracker are available on the web at:
https://theetfbully.com/newsletter-archives/