ETF/No Load Fund Tracker Newsletter For Friday, October 4, 2013
ETF/No Load Fund Tracker StatSheet
————————————————————-
THE LINK TO OUR CURRENT ETF/MUTUAL FUND STATSHEET IS:
https://theetfbully.com/2013/10/weekly-statsheet-for-the-etfno-load-fund-tracker-newsletter-updated-through-10032013/
————————————————————
Market Commentary
Friday, October 4, 2013
STOCKS IGNORE GOVERNMENT STAND-OFF
U.S. equities snapped their recent two-day losing streak, closing the trading session nicely higher despite the federal government shutdown continuing for a fourth day, with no signs of an end to the budget stalemate in Washington, while the showdown regarding increasing the approaching debt ceiling looms.
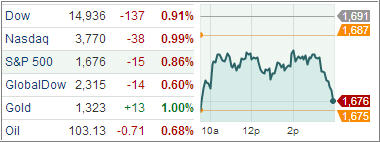
The Dow Jones Industrial Average closed 76 points higher (0.5%) at 15,073, reclaiming its mark above the psychologically significant 15,000 level. The S&P 500 Index ended up 12 points (0.7%) at 1,691, and the Nasdaq Composite increased 33 points (0.9%) to 3,808.
Meanwhile, Treasuries were lower, with today’s economic docket void of any major releases, as the September nonfarm payroll report was delayed by the Labor Department due to the government shutdown.
Equities climbed throughout the session while showing little concern over the lack of progress in the Capitol Hill stalemate. The major averages settled near their highs as all ten sectors registered gains.
The Nasdaq was the top performing index with biotechnology making a significant contribution. The iShares Nasdaq Biotechnology ETF (finished higher by 1.1%, also giving a boost to the health care sector (+1.1%). Meanwhile, the traditional technology sector (+0.5%) underperformed as top components traded in mixed fashion.
Also of note, the industrial sector (+0.5%) lagged in each of the past two sessions, and that was the case once again today. Transportation companies ended in-line with the sector (Dow Jones Transportation Average +0.5%) while defense contractors kept the group from logging additional gains.
With regards to countercyclical sectors, health care finished among the leaders while the remaining defensive groups-consumer staples, telecom services, and utilities-underperformed with modest gains of 0.2% apiece.
For the week, the Dow fell 1.2 percent; the S&P 500 lost 0.1 percent while the Nasdaq added 0.7 percent. The S&P 500 has fallen for nine of the past 12 sessions but is within striking distance of reclaiming its 1,700 level.
Government economic reports were empty as shutdown continues. Investors will get some new data to make trading decisions next week in the form of earnings reports. The 3Q earnings season will kick off unofficially on Tuesday, with Dow member Alcoa’s earnings report after the close of trading.
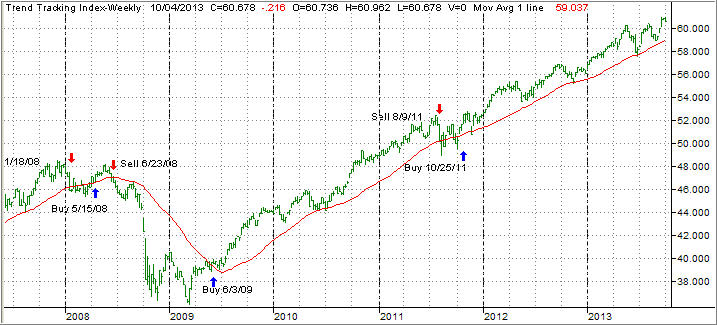
Despite this week’s ups and downs, our Trend Tracking Indexes (TTIs) gave back some ground and closed as follows:
Domestic TTI: +3.02% (last week +3.32%)
International TTI: +6.14% (last week +6.90%)
Have a great week.
Ulli…
————————————————————-
READER Q & A FOR THE WEEK
All Reader Q & A’s are listed at our web site!
Check it out at:
http://www.successful-investment.com/q&a.php
A note from reader Bill:
Q: Ulli: On 9-6-13, FOCPX dropped 8.8% about $6.66 per share. I called a Fidelity rep and he said because Apple fell 9-10% and FBIOX also declared and paid a Capital Gain and Dividend of around $1.189 per share, but it’s sort of floundering around not moving and actually down three days in a row for the last three days.
I guess my question is, are people getting out because of that drop and should I get out also?
I understand when a lot of people get out of a fund they have to sell off and that makes the fund drop.
A: Bill: Here’s how I look at it:
FOCPX made a high of 80.84 on 8/5/13, which would be the number to use for your trailing sell stop. Say, 7.5% of that high would put a sell signal at a break below 74.78, which happened only briefly before this fund recovered. I could not verify the distribution of $1.19.
If that is in fact correct, you need to reduce the high price by that amount, which would make the new high $79.65. Now you calculate the sell stop point of 7.5%, which brings it down to $73.68, which has not been reached yet.
That’s the process I go through to determine if a stop has been triggered. If it has, I will execute the next day, unless there is a huge rebound in the making.
Hope that clarifies your thinking.
———————————————————-
WOULD YOU LIKE TO HAVE YOUR INVESTMENTS PROFESSIONALLY MANAGED?
Do you have the time to follow our investment plans yourself? If you are a busy professional who would like to have his portfolio managed using our methodology, please contact me directly or get more details at:
https://theetfbully.com/personal-investment-management/
———————————————————
Back issues of the ETF/No Load Fund Tracker are available on the web at:
https://theetfbully.com/newsletter-archives/