12-13-2013

Ulli Newsletter Archives Contact

ETF/No Load Fund Tracker Newsletter For Friday, December 13, 2013

ETF/No Load Fund Tracker StatSheet

————————————————————-

THE LINK TO OUR CURRENT ETF/MUTUAL FUND STATSHEET IS:

https://theetfbully.com/2013/12/weekly-statsheet-for-the-etfno-load-fund-tracker-newsletter-updated-through-12122013/

————————————————————

Market Commentary

Friday, December 13, 2013

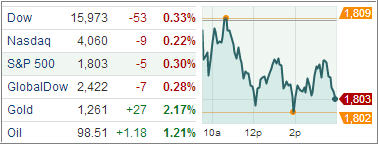
STOCKS STILL WAVERING UPON FED DECISION
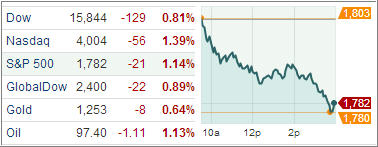
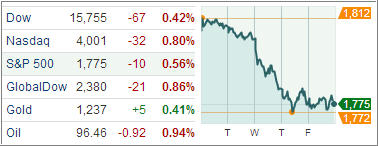
Fri chart

[Chart courtesy of MarketWatch.com]

1. Moving The Markets

Stocks had a mixed close on Friday as investors were cautious after a three-day drop and ahead of the Federal Reserve’s final policy meeting of the year next week. Stronger-than-expected American retail sales data during the week, coming after last week’s forecast-beating jobs report, have increased speculation that the Fed will start winding down its stimulative bond purchases soon. That would reduce the incentive that helped to drive global equities in recent months.

Such concerns have led United States-based funds to withdraw $6.51 billion from stock mutual funds in the last week, the biggest outflow this year, before the Fed’s two-day meeting next week

Emerging markets were also hit this week, with sell-offs in currencies — including the Indian Rupee and Japanese Yen — on concern that tighter Fed policy could sap flows of money into emerging markets and push up borrowing costs there. The prospects for a stronger dollar have in turn hit metals and oil, by making them more expensive for buyers outside the United States.

In the ETF world, materials and Industrials led the ETF herd today posting 0.48% and 0.30% gains respectively. Clearly markets are getting short-term oversold but Friday brought us little economic data leaving us the weekend to ponder the way ahead. Monday and Tuesday should be tense affairs before the FOMC announcement.

With the markets meandering, our ETFs in the spotlight retreated from their yearly highs:

2. ETFs in the Spotlight

In case you missed the announcement and description of this section, you can read it here again.

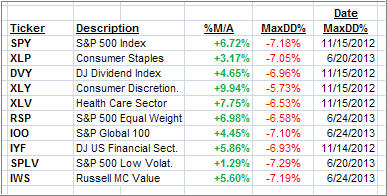
It features 10 broadly diversified ETFs from my HighVolume list as posted every Monday. Furthermore, they are screened for the lowest MaxDD% number meaning they have been showing better resistance to temporary sell offs than all others over the past year.

In other words, none of them ever triggered their 7.5% sell stop level during this time period, which included a variety of severe market pullbacks but no move into outright bear market territory.

Here are the 10 candidates:
MaxDD

All of them are in “buy” mode meaning their prices are above their respective long term trend lines by the percentage indicated (%M/A).

Now let’s look at the MaxDD% column and review the ETF with the lowest drawdown as an example. As you can see, that would be XLY with the lowest MaxDD% number of -5.73%, which occurred on 11/15/2012.

The recent sell off in the month of June did not affect XLY at all as its “worst” MaxDD% of -5.73% still stands since the November 2012 sell off.

A quick glance at the last column showing the date of occurrences confirms that five of these ETFs had their worst drawdown in November 2012, while the other five were affected by the June 2013 swoon, however, none of them dipped below their -7.5% sell stop.

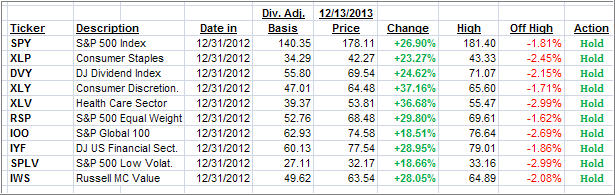
Year to date, here’s how the above candidates have fared so far:
YTD

This week’s sell off pulled all of our ETFs off their highs, but only modestly so considering the run up they’ve experienced YTD.

3. Domestic Trend Tracking Indexes (TTIs)

Looking at the big picture, our Trend Tracking Indexes (TTIs) retreated with the overall negative tone in the market. However, they remain above their long term trend lines by the following percentages:

Domestic TTI: +3.31% (last Friday +4.34%)

International TTI: +4.45% (last Friday +5.96%)

Have a great week.

Ulli…

Disclosure: I am obliged to inform you that I, as well as advisory clients of mine, own some of these listed ETFs. Furthermore, they do not represent a specific investment recommendation for you, they merely show which ETFs from the universe I track are falling within the guidelines specified.

————————————————————-

READER Q & A FOR THE WEEK

All Reader Q & A’s are listed at our web site!
Check it out at:

http://www.successful-investment.com/q&a.php

A note from reader Mike:

Q: Ulli: What is the difference between the “DD%” and the “trailing stop loss %”?

A: Mike: The DD% refers to the percentage a fund has come off its high. This is the high a fund has made since you purchased it, and it serves as a basis for calculating the trailing sell stop. For example, let’s assume you bought an ETF for $10 and it subsequently moves as follows for the next trading days: 10.05, 9.98, 10.15, 10.21, 10.30, 10.19, 10.14…

The high it has made in this data series is 10.30, which becomes the basis for calculating your 7.5% trailing sell stop, which would be at 9.52. If prices sink through 9.52, without taking out the high of 10.30 first, that would be your trigger point to exit the position.

In my weekly StatSheet listings, you can see the percentage a fund has come off its high in the DD% column. Once that number exceeds -7.5%, it means a sell signal for that fund has been generated. To be clear, if you bought this fund at a different time than shown in the StatSheet, you need to track your own highs (no pun intended) as mentioned above.

Hope this clarifies it.

———————————————————-

WOULD YOU LIKE TO HAVE YOUR INVESTMENTS PROFESSIONALLY MANAGED?

Do you have the time to follow our investment plans yourself? If you are a busy professional who would like to have his portfolio managed using our methodology, please contact me directly or get more details at:

https://theetfbully.com/personal-investment-management/

———————————————————

Back issues of the ETF/No Load Fund Tracker are available on the web at:
https://theetfbully.com/newsletter-archives/

ETF/No Load Fund Tracker Newsletter For Friday, December 13, 2013

Ulli ETF Tracker Contact

ETF/No Load Fund Tracker StatSheet

————————————————————-

THE LINK TO OUR CURRENT ETF/MUTUAL FUND STATSHEET IS:

https://theetfbully.com/2013/12/weekly-statsheet-for-the-etfno-load-fund-tracker-newsletter-updated-through-12122013/

————————————————————

Market Commentary

Friday, December 13, 2013

STOCKS STILL WAVERING UPON FED DECISION

Fri chart

[Chart courtesy of MarketWatch.com]

1. Moving The Markets

Stocks had a mixed close on Friday as investors were cautious after a three-day drop and ahead of the Federal Reserve’s final policy meeting of the year next week. Stronger-than-expected American retail sales data during the week, coming after last week’s forecast-beating jobs report, have increased speculation that the Fed will start winding down its stimulative bond purchases soon. That would reduce the incentive that helped to drive global equities in recent months.

Such concerns have led United States-based funds to withdraw $6.51 billion from stock mutual funds in the last week, the biggest outflow this year, before the Fed’s two-day meeting next week

Emerging markets were also hit this week, with sell-offs in currencies — including the Indian Rupee and Japanese Yen — on concern that tighter Fed policy could sap flows of money into emerging markets and push up borrowing costs there. The prospects for a stronger dollar have in turn hit metals and oil, by making them more expensive for buyers outside the United States.

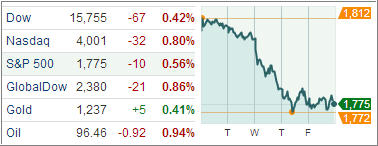
In the ETF world, materials and Industrials led the ETF herd today posting 0.48% and 0.30% gains respectively. Clearly markets are getting short-term oversold but Friday brought us little economic data leaving us the weekend to ponder the way ahead. Monday and Tuesday should be tense affairs before the FOMC announcement.

With the markets meandering, our ETFs in the spotlight retreated from their yearly highs:

Read More

Weekly StatSheet For The ETF/No Load Fund Tracker Newsletter – Updated Through 12/12/2013

Ulli ETF StatSheet Contact

ETF/Mutual Fund Data updated through Thursday, December 12, 2013

Table of Content082312

If you are not familiar with some of the terminology used, please see the Glossary of Terms.


1. DOMESTIC EQUITY MUTUAL FUNDS/ETFs: BUY — since 10/25/2011

TTI

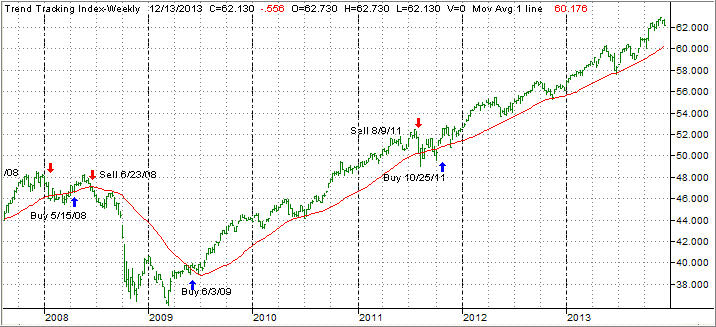
Our main directional indicator, the Domestic Trend Tracking Index (TTI) broke through its long-term trend line generating a Sell for this area effective 8/9/2011. Over the recent past, we’ve seen the TTI hovering slightly below and above this dividing line between bullish and bearish territory. The clear break to the upside occurred on 10/24/11 and, effective 10/25/11, a new Buy signal for domestic equities went into effect.

As of today, our Trend Tracking Index (TTI—green line in above chart) has bounced off its long term trend line (red) by +3.41% after briefly dipping below it late in June 2013.

To avoid a potential whip-saw, a Sell signal to move out of all domestic equity positions will be generated once we have clearly pierced the line to the downside. Be sure to tune in for the latest updates.

Read More

A Choppy Day On Wall Street; Jobless Claims Up

Ulli Market Commentary Contact

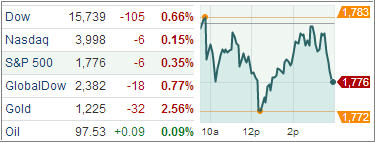
Thur pic

[Chart courtesy of MarketWatch.com]

1. Moving The Markets

Stocks extended losses in choppy trading amid mixed retailer sales and jobs data. In the tech world, Oracle (ORCL) stock slipped Thursday after the database leader was downgraded by Morgan Stanley and RBC Capital on valuation, worries over China’s IT spending and growing competition from cloud computing vendors. Facebook (FB) popped 5% and closed back above the 50 level in hefty trade. The stock hit a one-month high in reaction to late Wednesday’s news that it’s being added to the S&P 500.

The number of new weekly jobless claims recently reached the highest level in two months, according to government data released Thursday. The number of initial claims for unemployment benefits rose by 68,000 in the week that ended Dec. 7 to 368,000, above a consensus forecast of 335,000, according to U.S. Labor Department data. Although data during the holidays can be tough to analyze, trends indicate that jobless claims, a proxy for layoffs, are low, and that workers are gaining confidence in the labor market. Overall, the government’s recent employment report signaled that jobs have rebounded from a summer slump.

In ETF news today, Vanguard launched the Vanguard Global Minimum Volatility Fund, which offers two low-cost share classes—Investor Shares and Admiral Shares. Unlike a traditional active fund that seeks to outperform the market on an absolute basis, this fund is constructed to offer broad market exposure with a lower degree of share price fluctuations.

In robotics, ROBO-STOX LLC, the world leader in developing investment solutions targeting the robotics and automation space, has announced that the ROBO-STOX Global Robotics and Automation Index ETF (ROBO) amassed more than $25 million in assets under management as of November 30, 2013.

All of our ETFs in the Spotlight headed lower with consumer staples taking the lead after bucking the trend yesterday.

Read More

Euro Continues To Climb—Equities In The Red—Facebook To Join S&P 500

Ulli Market Commentary Contact

Wed pic

[Chart courtesy of MarketWatch.com]

1. Moving The Markets

Domestic Equities posted their largest drop in a month, with traders locking in recent gains after a provisional budget deal out of Washington. The bipartisan budget agreement reached late Tuesday would end three years of political confrontations and fiscal instability in Washington. The final Fed policy statement of the year is expected on December 18, at the end of a two-day meeting. It seems as we head toward the end of FY2013 that people are more concerned about locking in profits in positions that have had big gains this year.

In one of the few items of market-moving news on Wednesday, Costco’s (COST.O) profit missed Wall Street’s estimates because of higher stock-based compensation expenses and spending on technology. Its shares fell 1.2 percent to close at $118.57.

The euro rose for a seventh straight session against the dollar on Wednesday, driven by higher money market rates and a growing belief that the European Central Bank will keep interest rates low for some time but not cut them. The euro is at a six-week high and within striking distance of its best level versus the dollar in over two years. However, the euro zone still faces a long road to recovery, given the recent weak economic data, particularly in France.

ETF’s ended mostly in the red today with only Consumer Staples bucking the trend and showing gains of 0.16%. Facebook will join the S&P 500 on Dec. 20th. Facebook’s entry into the S&P 500 means the stocks will soon be found in some of the largest ETFs, including the largest in the world, the $166.1 billion SPDR S&P 500 (SPY) and the $51.2 billion iShares Core S&P 500 ETF (IVV).

All of our ETFs in the Spotlight slipped with the exception of Consumer Staples (XLP), which closed on the plus side:

Read More

Twitter Up, Inflation Down

Ulli Market Commentary Contact

Tue pic

[Chart courtesy of MarketWatch.com]

1. Moving The Markets

Stocks slipped in mixed volume as investors weighed a rise in job openings against concerns that the Federal Reserve will start to withdraw stimulus.

In the stock market today, Lumber Liquidators (LL) plunged 14% in huge volume, closing below its 200-day moving average, after its fourth-quarter earnings outlook came in slightly below expectations. Meanwhile, firearms maker Smith & Wesson (SWHC) was up sharply in post-session trading after its fiscal second-quarter earnings topped views. MasterCard (MA) was also up in the post-session after announcing a 10-for-1 stock split and boosting its quarterly dividend by 83%.  Elsewhere, November new issue Twitter (TWTR) jumped 6% to a new high, blowing past a 50.19 buy point in a narrow IPO base.

Inflation has fallen to a four-year low of 1%, with core inflation just 1.7%, according to the latest consumer price index. With inflation continuing to cool, the Federal Reserve wants to see faster price gains. But the central bank may quietly favor a big inflation spike to rev up the economy. In the current sluggish economy, companies are hoarding cash and consumers are paying down debt. Inflation expectations would encourage businesses to invest to take advantage of lower — possibly negative — real interest rates.

In the ETF world, BNY Mellon has been named to support the db X-trackers Harvest CSI 300 China A-Shares Fund (ASHR) by providing custody, fund accounting, administration, and transfer agency services. The fund, launched on NYSE Euronext on 6 November, is the first Renminbi Qualified Foreign Institutional Investor (RQFII) exchanged-traded fund available to US investors to invest in physical Chinese equities listed on the Shanghai and Shenzhen exchanges. Don’t forget, BNY Mellon is the primary service provider to Deutsche Bank’s ETF business in the US, which now encompasses 27 funds.

Our ETFs in the Spotlight eased a bit as the YTD table shows:

Read More