One Man’s Opinion: Have The Markets Turned Complacent?

Ulli Market Review Contact

92835431Equities have rallied 27 percent this year and that’s the cost of being bearish, though it is quite high, quipped Dean Curnutt, President and CEO of Macro Risk Advisors, when asked to comment on the distinctive feature of 2013 and the sudden market calm witnessed as of late.

To be relevant and to manage money these days, it’s hard not to be bullish, he added. The Volatility Index (VIX) chart that measures volatility on the greater 500 stocks of the S&P 500 index shows a reading of 20, indicating the situation is normal.

Asked if investors should be scared of the market calm in the US and other emerging markets such as Turkey, Indonesia and China, Dean said history shows that despite experiencing periods of market-crisis over and over again, investors tend to forget them easily.

Read More

New ETFs On The Block: Proshares Short Term USD Emerging Markets Bond ETF (EMSH)

Ulli Bond ETFs, Emerging Markets ETFs Contact

71030972ProShares, the Bethesda, MD-based sponsor of exchange-traded funds best known for its leveraged and inverse funds, has launched the ProShares Short Term USD Emerging Markets Bond ETF (EMSH). The firm is the nation’s largest provider of alternative ETFs with more than 140 products and has been attempting to expand its footprint in the regular unleveraged ETF segment as of late.

EMSH is the first short-term dollar-denominated emerging markets bond ETF to be launched in the US. The fund aims to reduce price volatilities arising out of interest rate changes and offers attractive yield potential for investors worried about rising interest rates.

The fund tracks the DBIQ Short Duration Emerging Market Bond Index, a benchmark developed by Deutsche Bank that includes a diversified portfolio of US dollar-denominated emerging market bonds with a dollar-weighted average maturity of three years or less. The debt issuers include sovereign governments, non-sovereign government agencies and corporations with sizable government ownership; i.e. the so-called quasi-sovereigns.

Read More

12-20-2013

Ulli Newsletter Archives Contact

ETF/No Load Fund Tracker Newsletter For Friday, December 20, 2013

ETF/No Load Fund Tracker StatSheet

————————————————————-

THE LINK TO OUR CURRENT ETF/MUTUAL FUND STATSHEET IS:

https://theetfbully.com/2013/12/10644/

————————————————————

Market Commentary

Friday, December 20, 2013

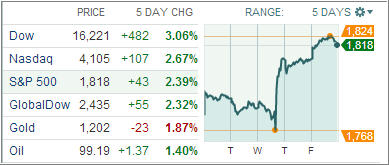
OVERALL, INVESTORS SATISFIED WITH FOMC DECISION
Fri pic

[Chart courtesy of MarketWatch.com]

1. Moving The Markets

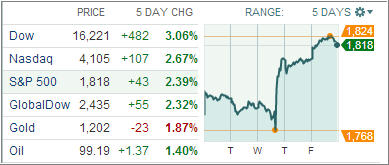
An eventful week has come to its end, and the markets are rather satisfied with the FOMC decision to modestly start tapering its monthly bond purchases by January 2014. The US dollar was stronger across the board, while the price action is smooth despite lower liquidities before the year-end holidays. The 10-year US treasuries stepped up to 2.92% – 2.95% range in New York yesterday, while the tension in emerging markets rises alongside with the higher US yields.

Bitcoin got slammed this week.  No surprise there.  It is in competition with the U.S. dollar, Yuan and the Euro.  What is a surprise is the revelation on Bloomberg that the London Gold vaults are “virtually empty.”  Where’s the gold now?  China.  There really is a finite amount of gold.

The Fed’s tapering decision is going over well in Europe exchange traded funds, with European stocks gaining for the third consecutive day and moving on their best weekly performance since April. The Vanguard FTSE Europe ETF (VGK) is up 1.9% since the Fed announcement Wednesday.

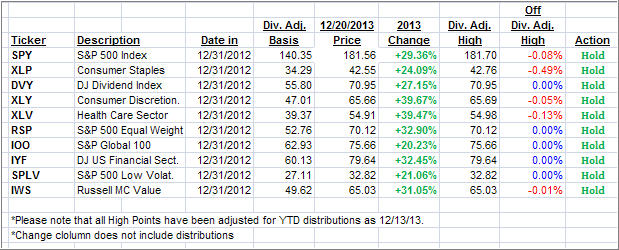
Half of our ETFs in the spotlight made new highs today, the other half has pulled back slightly.

2. ETFs in the Spotlight

In case you missed the announcement and description of this section, you can read it here again.

It features 10 broadly diversified ETFs from my HighVolume list as posted every Monday. Furthermore, they are screened for the lowest MaxDD% number meaning they have been showing better resistance to temporary sell offs than all others over the past year.

In other words, none of them ever triggered their 7.5% sell stop level during this time period, which included a variety of severe market pullbacks but no move into outright bear market territory.

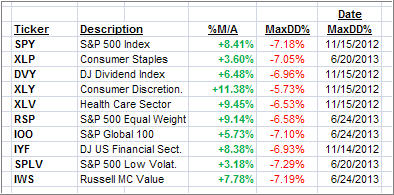
Here are the 10 candidates:
MaxDD

All of them are in “buy” mode meaning their prices are above their respective long term trend lines by the percentage indicated (%M/A).

Now let’s look at the MaxDD% column and review the ETF with the lowest drawdown as an example. As you can see, that would be XLY with the lowest MaxDD% number of -5.73%, which occurred on 11/15/2012.

The recent sell off in the month of June did not affect XLY at all as its “worst” MaxDD% of -5.73% still stands since the November 2012 sell off.

A quick glance at the last column showing the date of occurrences confirms that five of these ETFs had their worst drawdown in November 2012, while the other five were affected by the June 2013 swoon, however, none of them dipped below their -7.5% sell stop.

Year to date, here’s how the above candidates have fared so far:
ytd

3. Domestic Trend Tracking Indexes (TTIs)

Looking at the big picture, our Trend Tracking Indexes (TTIs) advanced with the overall positive tone in the market and remain above their long term trend lines by the following percentages:

Domestic TTI: +4.31% (last Friday +3.31%)

International TTI: +5.95% (last Friday +4.45%)

Have a great week.

Ulli…

Disclosure: I am obliged to inform you that I, as well as advisory clients of mine, own some of these listed ETFs. Furthermore, they do not represent a specific investment recommendation for you, they merely show which ETFs from the universe I track are falling within the guidelines specified.

————————————————————-

READER Q & A FOR THE WEEK

All Reader Q & A’s are listed at our web site!
Check it out at:

http://www.successful-investment.com/q&a.php

A note from reader Jack:

Q: Ulli: I like your new format the daily market commentary.
Will you continue showing these ETFs in the spotlight new year?

A: Jack: Yes, I will update these 10 ETFs every day along with a continuation of their “High” points and 2014 YTD figures in a newly added “Change” column.

Keep in mind that a new year does not change any of the calculations in regards to determining the trailing sell stop points. Of course, I need to point out that you may have different “High” points depending on your purchase date of the ETFs.

———————————————————-

WOULD YOU LIKE TO HAVE YOUR INVESTMENTS PROFESSIONALLY MANAGED?

Do you have the time to follow our investment plans yourself? If you are a busy professional who would like to have his portfolio managed using our methodology, please contact me directly or get more details at:

https://theetfbully.com/personal-investment-management/

———————————————————

Back issues of the ETF/No Load Fund Tracker are available on the web at:

https://theetfbully.com/newsletter-archives/

ETF/No Load Fund Tracker Newsletter For Friday, December 20, 2013

Ulli ETF Tracker Contact

ETF/No Load Fund Tracker StatSheet

————————————————————-

THE LINK TO OUR CURRENT ETF/MUTUAL FUND STATSHEET IS:

https://theetfbully.com/2013/12/10644/

————————————————————

Market Commentary

Friday, December 20, 2013

OVERALL, INVESTORS SATISFIED WITH FOMC DECISION

Fri pic

[Chart courtesy of MarketWatch.com]

1. Moving The Markets

An eventful week has come to its end, and the markets are rather satisfied with the FOMC decision to modestly start tapering its monthly bond purchases by January 2014. The US dollar was stronger across the board, while the price action is smooth despite lower liquidities before the year-end holidays. The 10-year US treasuries stepped up to 2.92% – 2.95% range in New York yesterday, while the tension in emerging markets rises alongside with the higher US yields.

Bitcoin got slammed this week.  No surprise there.  It is in competition with the U.S. dollar, Yuan and the Euro.  What is a surprise is the revelation on Bloomberg that the London Gold vaults are “virtually empty.”  Where’s the gold now?  China.  There really is a finite amount of gold.

The Fed’s tapering decision is going over well in Europe exchange traded funds, with European stocks gaining for the third consecutive day and moving on their best weekly performance since April. The Vanguard FTSE Europe ETF (VGK) is up 1.9% since the Fed announcement Wednesday.

Half of our ETFs in the spotlight made new highs today, the other half has pulled back slightly.

Read More

Weekly StatSheet For The ETF/No Load Fund Tracker Newsletter – Updated Through 12/19/2013

Ulli ETF StatSheet Contact

ETF/Mutual Fund Data updated through Thursday, December 19, 2013

Table of Content082312

If you are not familiar with some of the terminology used, please see the Glossary of Terms.


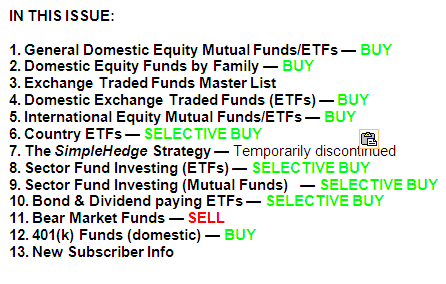
1. DOMESTIC EQUITY MUTUAL FUNDS/ETFs: BUY — since 10/25/2011

TTI

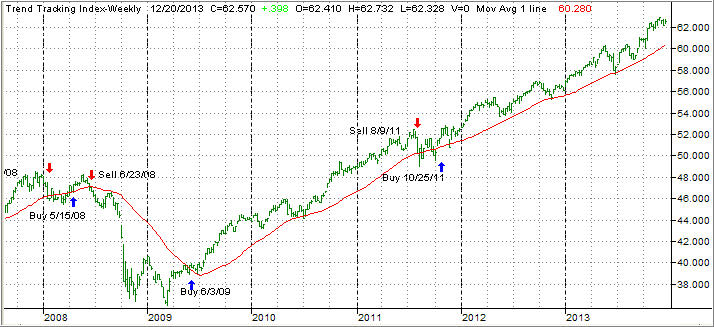
Our main directional indicator, the Domestic Trend Tracking Index (TTI) broke through its long-term trend line generating a Sell for this area effective 8/9/2011. Over the recent past, we’ve seen the TTI hovering slightly below and above this dividing line between bullish and bearish territory. The clear break to the upside occurred on 10/24/11 and, effective 10/25/11, a new Buy signal for domestic equities went into effect.

As of today, our Trend Tracking Index (TTI—green line in above chart) has bounced off its long term trend line (red) by +3.97% after briefly dipping below it late in June 2013.

To avoid a potential whip-saw, a Sell signal to move out of all domestic equity positions will be generated once we have clearly pierced the line to the downside. Be sure to tune in for the latest updates.

Read More

Fed Decision Not Ideal For Gold

Ulli Market Commentary Contact

Thur pic

[Chart courtesy of MarketWatch.com]

1. Moving The Markets

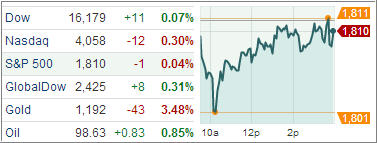
U.S. stock indexes ended up pretty much where they started on Thursday, a day after a powerful surge. It seems financial markets were still digesting the Fed’s move on Thursday. While stocks were holding close to record levels, Treasury yields climbed, the dollar rose and gold slumped to its lowest in more than three years. Apparently, investors are dumping their holdings of gold because interest rates are rising and the dollar is gaining after the Fed said it would pare back its bond purchases. Traders are selling gold because they see less risk of inflation from the Fed’s stimulus program.

Among heavily traded DJIA stocks, today’s biggest gainer was Chevron Corp. (CVX) which opened flat this morning before climbing, as investors seemed to interpret the improving economic news as leading to more demand for energy.

Meanwhile, in the ETF world, several funds stole the show and saw huge moves following the tapering announcement:  Homebuilder ETFs, Gold Mining ETFs and Volatility ETFs. In particular, the SPDR S&P Homebuilders ETF and the iShares US Home Construction ETF posted big gains; the Market Vectors Gold Mining ETF and Market Vectors Junior Gold Miners ETF both rallied; and  the iPath S&P 500 VIX Short Term Futures ETN slid by more than 5%.

Our ETFs in the Spotlight moved pretty much sideways and came off their yearly highs by a small margin:

Read More