Weekly StatSheet For The ETF/No Load Fund Tracker Newsletter – Updated Through 12/26/2013

Ulli ETF StatSheet Contact

ETF/Mutual Fund Data updated through Thursday, December 26, 2013
Table of Content082312

If you are not familiar with some of the terminology used, please see the Glossary of Terms.


1. DOMESTIC EQUITY MUTUAL FUNDS/ETFs: BUY — since 10/25/2011
TTI

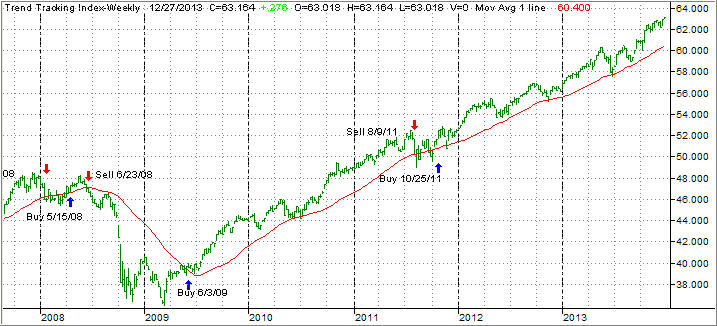
Our main directional indicator, the Domestic Trend Tracking Index (TTI) broke through its long-term trend line generating a Sell for this area effective 8/9/2011. Over the recent past, we’ve seen the TTI hovering slightly below and above this dividing line between bullish and bearish territory. The clear break to the upside occurred on 10/24/11 and, effective 10/25/11, a new Buy signal for domestic equities went into effect.

As of today, our Trend Tracking Index (TTI—green line in above chart) has bounced off its long term trend line (red) by +4.77% after briefly dipping below it late in June 2013.

To avoid a potential whip-saw, a Sell signal to move out of all domestic equity positions will be generated once we have clearly pierced the line to the downside. Be sure to tune in for the latest updates.
Read More

A Decline In Jobless Claims Equals A Rise In Stock Prices

Ulli Market Commentary Contact

Thur pic

[Chart courtesy of MarketWatch.com]

1. Moving The Markets

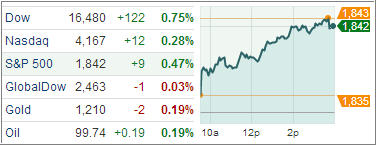
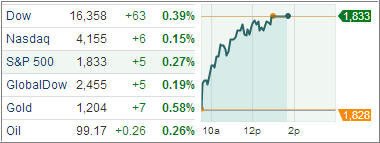
Following the theme from last week, domestic equities extended their record run, as the bulls had their way again pushing the major indexes, and our 10 ETFs in the Spotlihgt, into record territory.

Throwing an assist and keeping the upward trend alive was the Labor Department’s report, which said that the number of Americans claiming weekly unemployment benefits for the first time dropped by 42,000 to 338,000. Of course, these figures tend to be volatile, but right now they’re indicating that workers are gaining some means of confidence in the job market.

On the other side of the coin, the bear market in bonds/treasuries continues as the benchmark 10-year hit the 3% level today for the first time since September as rates moved higher.

With the continuation of recent upside momentum in equities, all of our ten ETFs in the Spotlight made new highs today. Take a look at the YTD table below.

Read More

Happy Holidays!

Ulli Uncategorized Contact

Hope your Holiday season is fun, festive and full of compassion, tolerance, peace and happiness.

Ulli…

SPY And DIA Head Into Record Territory

Ulli Market Commentary Contact

Tue pic

[Chart courtesy of MarketWatch.com]

1. Moving The Markets

The Christmas rally continued today with the Dow and S&P 500 eking out another record close during this Holiday-shortened session caused by a positive durable goods orders report. Big ticket items (aircraft and transportation equipment) rose 3.5% vs. an expected 2%.

Home prices gained 8.2% in October from the same month last year, while they edged up 0.5% from September. Surprisingly, so far rising mortgage rates have not yet put a lid on single-family home sales.

Historically, December has been a good month for stocks and, so far, this year appears to be no exception. With traders now having received some clarity from the Fed in regards to tapering, we may see this current momentum carry into next year. Of course, there are always unintended consequences, which could spoil the best made plans. That is why we have our trailing sell stops indentified and ready to be executed should the need arise.

To no surprise, seven out of our ten ETFs in the Spotlight made new highs today; the other three are very close as the second table below shows.

Read More

Major Indexes Continue To Rally; Dollar Expected To Appreciate In 2014

Ulli Market Commentary Contact

Mon pic

[Chart courtesy of MarketWatch.com]

1. Moving The Markets

U.S. stocks climbed on Monday, with the Dow industrials and S&P 500 again closing at records, as Apple and Facebook led a rally in the technology sector and after data showed consumer sentiment at a five-month high and spending up in November. Facebook jumped as the social-networking site’s first day of trading as one of the S&P 500 companies. Shares of Apple gained after it reached a deal to sell its iPhones through China Mobile, the biggest phone company on the globe.

The dollar lost ground against the currencies of major U.S. trading partners while the yield on the 10-year Treasury note used in figuring mortgage rates and other consumer loans rose 4 basis points to 2.93 percent.

This month WisdomTree is back with its latest launch of The WisdomTree Bloomberg U.S. Dollar Bullish Fund (USDU), which seeks to provide exposure to the U.S. dollar against a broad basket of developed and emerging market currencies. The timing of this launch seems to be perfect, given that Fed will eventually begin its taper program in early 2014.

The Fed’s decision has finally revived hopes for the U.S. dollar. Investors who had unwound their long positions in the dollar after a prior No Taper from the Fed are considering adding long positions now. Although the dollar lost ground today, it is expected to rise going into the New Year against major currencies.

Eight out of our ten ETFs in the Spotlight made new highs today; the other two are hovering within striking distance.

Read More

ETFs/Mutual Funds On The Cutline – Updated Through 12/20/2013

Ulli ETFs on the Cutline Contact

Below are the latest ETF Cutline reports, which show how far above or below their respective long-term trend lines (39 week SMA) my currently tracked ETFs/MFs are positioned.

The first report covers the ETF Master List from Thursday’s StatSheet and includes 398 ETFs, of which currently 304 (last week 320) are hovering in bullish territory.

The second report includes only High Volume ETFs. To clarify, High Volume (HV) ETFs are defined as those with an average daily volume of $10 million or higher.

These ETFs are generated from my selected list of some 93 that I use in my advisor practice. It cuts out the “noise,” which simply means it eliminates those ETFs that I would never buy because of their volume limitations. 60 ETFs (last week 65) have managed to remain in bullish territory after the recent market volatility.

The third report covers Mutual Funds on the Cutline. There are currently 697 (last week 719) above the line and 153 below it out of the 859 that I follow.

Take a look:

1. ETF Master Cutline Report     

2. ETF High Volume Cutline Report

3. MF Cutline Report

In case you are not familiar with some of the terminology used in the reports, please read the Glossary of Terms.

If you missed the original post about the Cutline approach, you can read it here.