Investors Optimistic As We Head Into 2014

Ulli Market Commentary Contact

Mon pic

[Chart courtesy of MarketWatch.com]

1. Moving The Markets

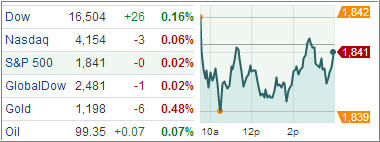
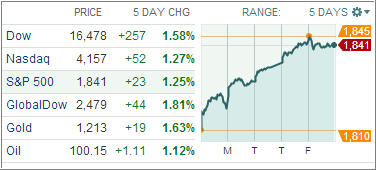
After years, in which financial markets lurched from the debt crisis in Europe to U.S. political deadlock, investors are generally becoming more upbeat on the global economic outlook. However, U.S. equity indices closed flat on Monday as light trading heading into the New Year holiday left many market participants on the sidelines at the end of what is expected to be the best year for stocks since 1997. The S&P 500 is up sharply YTD, and many investment strategists remain positive that the market will post another gain in 2014.

U.S. benchmark yields slipped below the 3 percent threshold after they hit a two-year high last week on expectations of improving domestic growth as the Federal Reserve begins to pare its massive bond-purchase stimulus in January. Views on economic improvement further reduced the appeal of gold, which will record its biggest annual loss in 32 years. Oil prices fell to near $111 a barrel in London on signs crude exports from Libya might return to normal due to a possible end to a four-month blockage of a key port.

In the ETF world, iShares, the exchange-traded funds platform of BlackRock, has announced the launch of the iShares Euro Stoxx 50 ex-Financials UCITS ETF (EXFN). The fund, listed on the London Stock Exchange, offers investors access to large-cap Eurozone equities whilst stripping out financial exposures such as banks and insurance companies. The fund will be Europe’s first ETF to come to market with an international security structure.

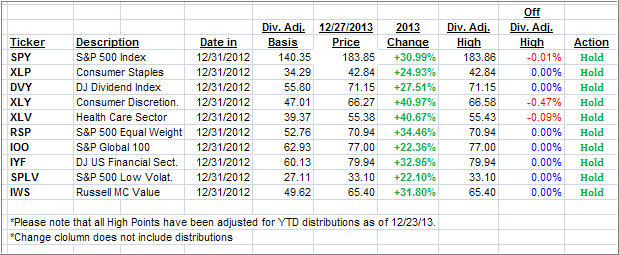
With the continuation of recent upside momentum in equities, seven of our ten ETFs in the Spotlight made new highs today. Take a look at the YTD table below.

Read More

ETFs/Mutual Funds On The Cutline – Updated Through 12/27/2013

Ulli ETFs on the Cutline Contact

Below are the latest ETF Cutline reports, which show how far above or below their respective long-term trend lines (39 week SMA) my currently tracked ETFs/MFs are positioned.

The first report covers the ETF Master List from Thursday’s StatSheet and includes 398 ETFs, of which currently 331 (last week 304) are hovering in bullish territory.

The second report includes only High Volume ETFs. To clarify, High Volume (HV) ETFs are defined as those with an average daily volume of $10 million or higher.

These ETFs are generated from my selected list of some 93 that I use in my advisor practice. It cuts out the “noise,” which simply means it eliminates those ETFs that I would never buy because of their volume limitations. 60 ETFs (last week 65) have managed to remain in bullish territory after the recent market volatility.

The third report covers Mutual Funds on the Cutline. There are currently 708 (last week 697) above the line and 142 below it out of the 859 that I follow.

Take a look:

1. ETF Master Cutline Report     

2. ETF High Volume Cutline Report

3. MF Cutline Report

In case you are not familiar with some of the terminology used in the reports, please read the Glossary of Terms.

If you missed the original post about the Cutline approach, you can read it here.

Please note that Mutual fund prices have not been adjusted for year end distributions.

One Man’s Opinion: Would An Interest Rate Hike By The Fed In 2014 Be Calamitous?

Ulli Market Review Contact

92835431There is too much optimism as markets go into 2014, and it’s really easy to get caught up in all the good news at this time of the year, said James Bevan, Chief Investment Officer at CCLA Investment Management.

Realistically, the fundamentals are very strong, the central banks very supportive and the companies are saying all the right things. The question is what might go wrong? Risk number one, of course, is the US as there is a broad expectation the economy is moving at a rate that is consistent with the Fed taking some money away from support but still delivering growth.

Now, if there is too much growth, the Fed may act much more aggressively, potentially raising interest rates ahead of expectations, which could be calamitous for the markets, James said.

Read More

New ETFs On The Block: Cambria Foreign Shareholder Yield ETF (FYLD)

Ulli Equity ETFs Contact

105487691Cambria Investment Management, a California-based upstart investment adviser, has launched its third exchange-traded fund in an effort to expand the firm’s portfolio of the so-called “shareholder yield” products.

The Cambria Foreign Shareholder Yield ETD (FYLD) is the global equivalent of a newly minted, but fairly successful domestic predecessor – the Cambria Shareholder Yield ETF (SYLD), which has already attracted more than $170 million in investments so far this year.

Listed on the NYSE Arca, FYLD screens for companies that have a history of strong dividend payouts, and carrying out share-buyback activities. The fund tracks the Cambria Foreign Shareholder Yield Index, a benchmark that focuses on non-US developed market stocks and gives access to about 100 securities with high shareholder yields.

Read More

12-27-2013

Ulli Newsletter Archives Contact

ETF/No Load Fund Tracker Newsletter For Friday, December 27, 2013

ETF/No Load Fund Tracker StatSheet

————————————————————-

THE LINK TO OUR CURRENT ETF/MUTUAL FUND STATSHEET IS:

https://theetfbully.com/2013/12/weekly-statsheet-for-the-etfno-load-fund-tracker-newsletter-updated-through-12262013/

————————————————————

Market Commentary

Friday, December 27, 2013

EQUITIES POISED FOR BEST YEAR SINCE 1997
Fri pic

[Chart courtesy of MarketWatch.com]

1. Moving The Markets

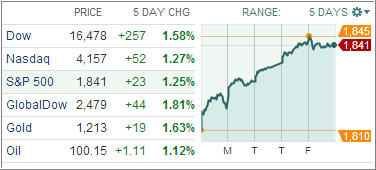
The equity markets look to be closing in on a stellar year, bolstered by ongoing Federal Reserve stimulus and the alleged return of a robust U.S. economy. Though rising throughout the morning today, major U.S. markets reversed direction by midday, if only minimally, seemingly putting the brakes on a “Santa Claus” rally which propelled the Dow Jones Industrial Average to a record closing high on Thursday. Even so, with only three trading sessions left in 2013, equities are set to end the year with the best performance since 1997.

The bond/treasuries bears are awaking from hibernation it seems as U.S. benchmark government bond yields increased to more than 3% on Friday, a two-and-a-half year high. The U.S. 10-year Treasury note yield topped 3.02%, which is usually a sign the U.S. economy is steadily improving.

Even if you believe the numbers, an estimated 1.3 million long-term unemployed workers will lose essential federal unemployment benefits on Saturday, a product of the bipartisan federal budget agreed upon this month to curtail government spending. The number of long-term unemployed ballooned to more than 6.7 million in the first half 2010 but has since declined to 4 million.

Seven of our ten ETFs in the spotlight made new highs today; the remaining three have pulled back only slightly.

2. ETFs in the Spotlight

In case you missed the announcement and description of this section, you can read it here again.

It features 10 broadly diversified ETFs from my HighVolume list as posted every Monday. Furthermore, they are screened for the lowest MaxDD% number meaning they have been showing better resistance to temporary sell offs than all others over the past year.

In other words, none of them ever triggered their 7.5% sell stop level during this time period, which included a variety of severe market pullbacks but no move into outright bear market territory.

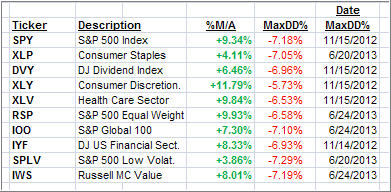
Here are the 10 candidates:
MaxDD

All of them are in “buy” mode meaning their prices are above their respective long term trend lines by the percentage indicated (%M/A).

Now let’s look at the MaxDD% column and review the ETF with the lowest drawdown as an example. As you can see, that would be XLY with the lowest MaxDD% number of -5.73%, which occurred on 11/15/2012.

The recent sell off in the month of June did not affect XLY at all as its “worst” MaxDD% of -5.73% still stands since the November 2012 sell off.

A quick glance at the last column showing the date of occurrences confirms that five of these ETFs had their worst drawdown in November 2012, while the other five were affected by the June 2013 swoon, however, none of them dipped below their -7.5% sell stop.

Year to date, here’s how the above candidates have fared so far:
YTD

3. Domestic Trend Tracking Indexes (TTIs)

Looking at the big picture, our Trend Tracking Indexes (TTIs) advanced with the overall positive tone in the market and remain above their long term trend lines by the following percentages:

Domestic TTI: +4.58% (last Friday +4.31%)

International TTI: +7.05% (last Friday +5.95%)

Have a great week.

Ulli…

Disclosure: I am obliged to inform you that I, as well as advisory clients of mine, own some of these listed ETFs. Furthermore, they do not represent a specific investment recommendation for you, they merely show which ETFs from the universe I track are falling within the guidelines specified.

————————————————————-

READER Q & A FOR THE WEEK

All Reader Q & A’s are listed at our web site!
Check it out at:

http://www.successful-investment.com/q&a.php

A note from reader Jack:

Q: Ulli: I like your new format the daily market commentary.
Will you continue showing these ETFs in the spotlight new year?

A: Jack: Yes, I will update these 10 ETFs every day along with a continuation of their “High” points and 2014 YTD figures in a newly added “Change” column.

Keep in mind that a new year does not change any of the calculations in regards to determining the trailing sell stop points. Of course, I need to point out that you may have different “High” points depending on your purchase date of the ETFs.

———————————————————-

WOULD YOU LIKE TO HAVE YOUR INVESTMENTS PROFESSIONALLY MANAGED?

Do you have the time to follow our investment plans yourself? If you are a busy professional who would like to have his portfolio managed using our methodology, please contact me directly or get more details at:

https://theetfbully.com/personal-investment-management/

———————————————————

Back issues of the ETF/No Load Fund Tracker are available on the web at:

https://theetfbully.com/newsletter-archives/

 

ETF/No Load Fund Tracker Newsletter For Friday, December 27, 2013

Ulli ETF Tracker Contact

ETF/No Load Fund Tracker StatSheet

————————————————————-

THE LINK TO OUR CURRENT ETF/MUTUAL FUND STATSHEET IS:

https://theetfbully.com/2013/12/weekly-statsheet-for-the-etfno-load-fund-tracker-newsletter-updated-through-12262013/

————————————————————

Market Commentary

Friday, December 27, 2013

EQUITIES POISED FOR BEST YEAR SINCE 1997

Fri pic

[Chart courtesy of MarketWatch.com]

1. Moving The Markets

The equity markets look to be closing in on a stellar year, bolstered by ongoing Federal Reserve stimulus and the alleged return of a robust U.S. economy. Though rising throughout the morning today, major U.S. markets reversed direction by midday, if only minimally, seemingly putting the brakes on a “Santa Claus” rally which propelled the Dow Jones Industrial Average to a record closing high on Thursday. Even so, with only three trading sessions left in 2013, equities are set to end the year with the best performance since 1997.

The bond/treasuries bears are awaking from hibernation it seems as U.S. benchmark government bond yields increased to more than 3% on Friday, a two-and-a-half year high. The U.S. 10-year Treasury note yield topped 3.02%, which is usually a sign the U.S. economy is steadily improving.

Even if you believe the numbers, an estimated 1.3 million long-term unemployed workers will lose essential federal unemployment benefits on Saturday, a product of the bipartisan federal budget agreed upon this month to curtail government spending. The number of long-term unemployed ballooned to more than 6.7 million in the first half 2010 but has since declined to 4 million.

Seven of our ten ETFs in the spotlight made new highs today; the remaining three have pulled back only slightly.

Read More